Table of Contents
Report
Solar Dehydrator

Produced by
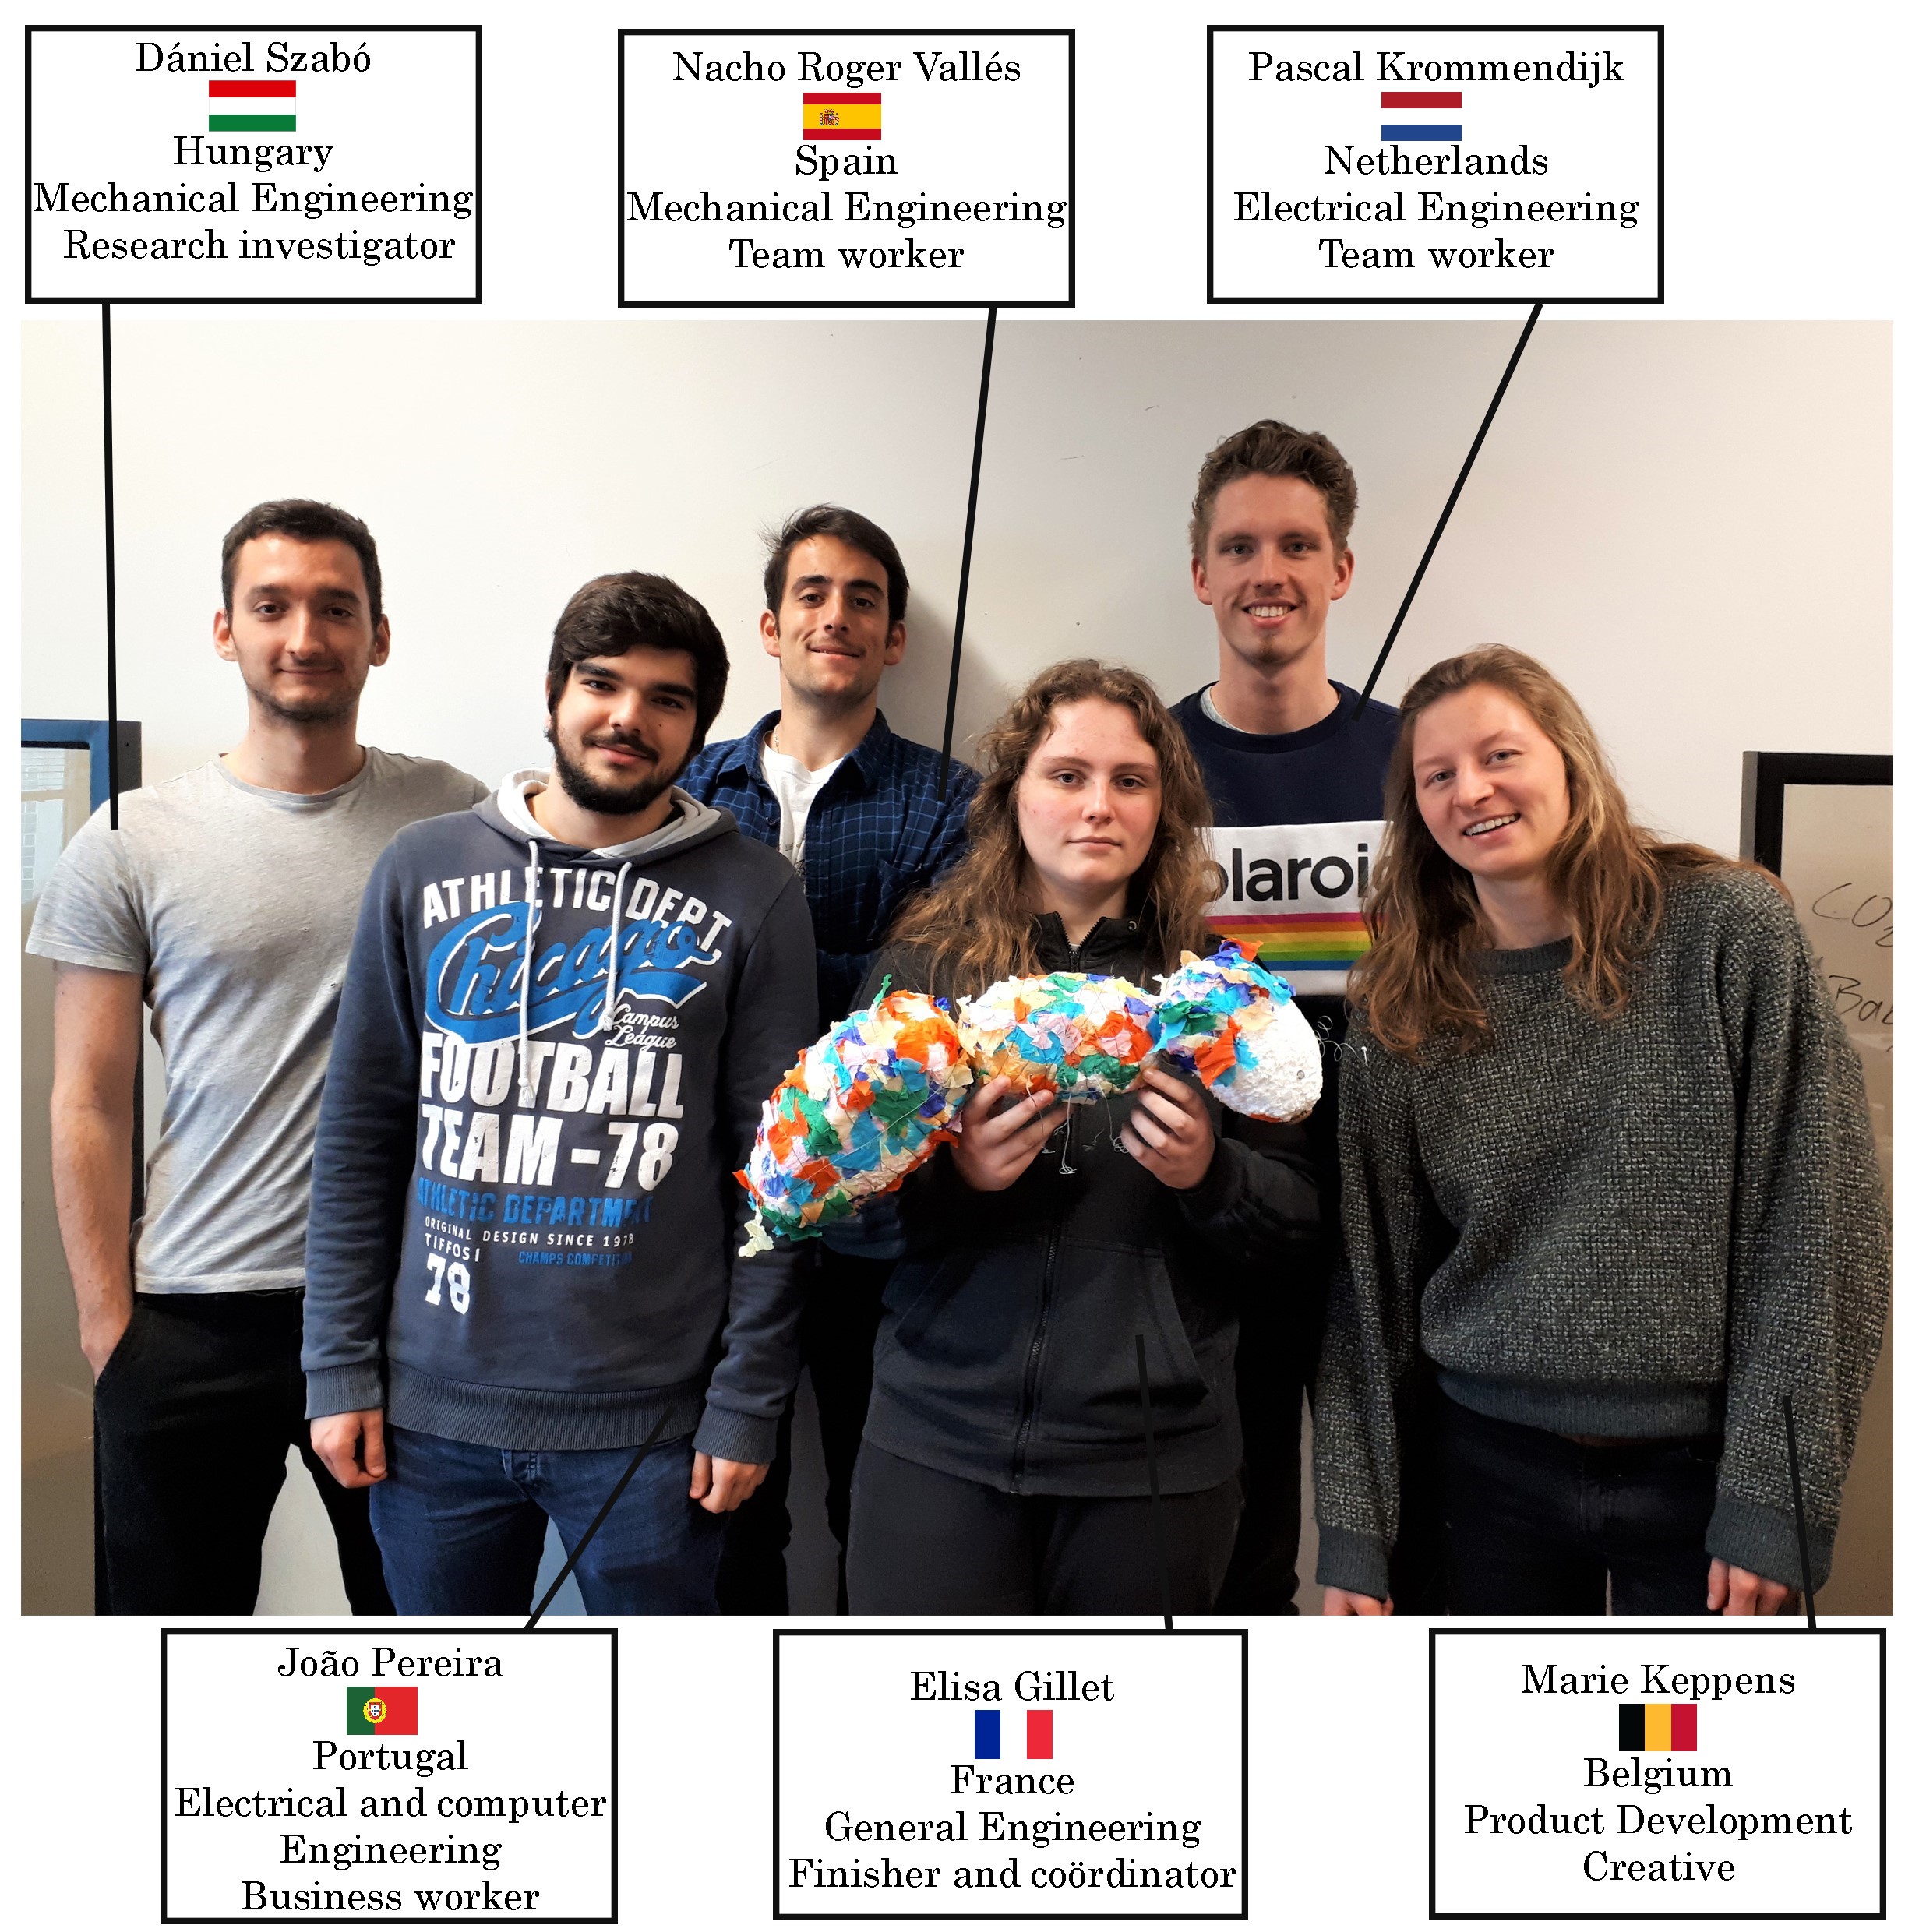
João Pereira
Dániel Szabó
Elisa Gillet
Marie Keppens
Pascal Krommendijk
Ignacio Roger

Acknowledgement
The students of team 2 would like to thank the Instituto Superior de Engenharia do Porto for the unique experience this project gave them. The team also acknowledges the support of the supervisors who were constantly checking on the project and gave feedback and tips in the crucial moments during the development.
Glossary
| Abbreviation | Description |
|---|---|
| B2B | Business-to-business |
| B2C | Business-to-customer |
| CO2 | Carbon Dioxide |
| EPS | European Project Semester |
| EU | European Union |
| IC | Integrated Circuit |
| ISEP | Instituto Superior de Engenharia do Porto |
| LCD | Liquid-Crystal Display |
| LED | Light-Emitting Diode |
| MDF | Medium Density Fiberboard |
| NTC | Negative Temperature Coefficient |
| PDCA | Plan Do Check Act |
| PESTEL | Political Economic Social Technological Environmental Legal |
| PVC | Polyvinyl chloride |
| SMART | Specific Measurable Achievable Realistic Timely |
| SWOT | Strengths Weaknesses Opportunities Threats |
| USB | Universal Serial Bus |
| UV | Ultraviolet |
| WBS | Work Breakdown Structure |
1. Introduction
In the first chapter of the report, the general information will be presented as followed: the team and their motivation are stated first, then related to the actual project topic the problem, objectives, requirements the basic functional tests are presented in lists and small paragraphs. After that organizing topics like the project planning and the report structure are made to give a better understanding for the reader.
1.1 Presentation
The ChameleAnt group consists of six different persons from different countries with different cultures, habits, and expectations. The team name came to life due to the principles match the qualities of a chameleon and an ant. For example, just like a chameleon, the directive is to embrace each of these differences and adjust to the others to become a better and closer team. Next, to that, each member is expected to work together for the benefit of the group just like ants do. By being able to use all the different (educational) skills existing, the aim of the project is to develop a great solution for a solar dehydrator product while enjoying and learning from the knowledge of every single member. Figure 1 identifies each member of the team including their nationalities and backgrounds.
1.2 Motivation
The ChameleAnt's members are participating in the European Project Semester (EPS) with the aim of learning and achieving certain personal and community-related goals. These were defined during team-building sessions in the third week of February, before designing and artistically creating the group's mascot. Not only were taken into consideration the principles of the EPS program and adjusting those to the specific group criteria, but it was also agreed to support and maintain the focus on the goals by evaluating their progress frequently. The team objectives are as follow:
- Strengthen Teamwork
- Explore different cultures throughout the project
- Integrate study, explore and use every member's special ability
- Communication skills
- Avoid assumptions, discuss more
- Trust
During the following months, the group members of ChameleAnt are striving to achieve those goals. Next, to the team’s personal objectives, the main motivation in this specific project comes from the urge of making an impact on the world. Sustainability is one of the key aspects to consider these days and that is why excitement and motivation are necessary to contribute to getting one step closer to full sustainability by developing a solar dehydrator.
1.3 Problem
The problem regarding this project is that fresh food has a large volume and needs energy consuming storage support in order to keep the lifecycle longer. Next to that the costs of keeping the fresh unprocessed food really fresh are higher than ever before. The main costs will be seen in the amount of waste that results in fresh food not being consumed in time.
Furthermore, related to the actual project development, the problems the team might encounter are reaching the goals of high sustainability and low energy consumption while staying in budget, as there could be expensive materials or electronics. There are also unknown topics like the biology of food and natural materials that could challenge the team's current expertise. The team also has to take different properties of different types of food into account while trying to dry it and make sure the food does not get moldy or too dried out.
1.4 Objectives
The objectives for this project are to conceive a device by designing and developing a dehydrator product from scratch. This device needs to fulfill certain requirements such as being powered by solar energy. It has the purpose of preserving food for longer use, preventing any bacteria on food, and also preventing mold, with minimal or close to none energy consumption. In other words, it has to be a sustainable product for the future at the lowest cost possible.
Furthermore, on a more educational meta-level, the project team is dedicated to improving existing abilities. These are summarized as follow:
- Open communication in a multidisciplinary and multicultural group
- Teamworking combined with abstract problem solving
- Discovering new branches of industries, studies, and work methods
- Having sustainability and low costs in the main focus
This all means a strive towards a better future. Taking into consideration that in order to improve at any level, it is essential to always be open to receive feedback.
1.5 Requirements
The project requirements are:
- Re-using existing components or using low cost hardware solutions;
- Complying with the following EU Directives:
- Mandatory adoption and use of the International System of Units 6);
- Using open source software and technologies;
- Maximum budget: 100 €;
- Drying food in a healthy way by avoiding any bacteria;
- Sustainable and green operation, production and materials.
1.6 Functional Tests
For now, the team thought about some tests that could be interesting to realize such as :
- Optimal temperature range and angle of the solar panel
- What are the dimensions the fan to create the best airflow
- Using a dark chamber to reduce/eliminate the loss of nutrition
- How to shift/rotate the products periodically
- If it is necessary, the process can be made faster by cutting the products in half
- What is the proper temperature after the surface moisture is gone
- Using a conductive material could be useful to make the process more effective
- After the drying process, how much is the water level value that has to be reached
There are 2 types of airflow in the dehydrator: the first one is the natural circulation where the airflow is driven by the temperature difference and the second one is forced convection where the airflow is driven by a fan which can be powered by a battery or a solar panel, depending on the size of the fan.
1.7 Project Planning
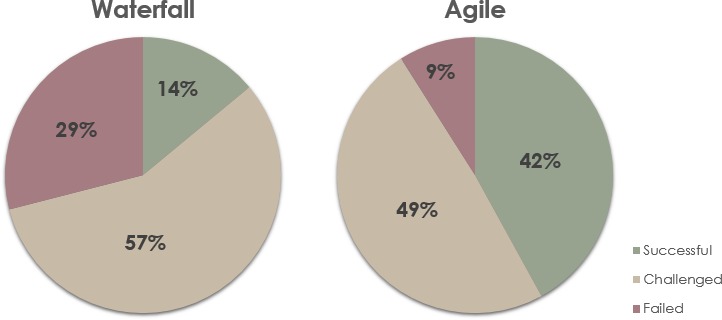
Project planning englobes all the setups necessary in order for a project to succeed. It is the process of establishing the steps required to define the project objectives, clarify the scope of what needs to be done and develop the list of tasks to do that. It is also known as Project Backlog 7). The team chooses to, instead of using the classical approach in project management and planning, the waterfall, to use an agile approach with the Scrum methodology. This choice was made taking in consideration not only the supervisor's recommendations but also the ability to adjust to change better than the waterfall model and the existence of studies comparing the results of both, favoring the agile approach, as shown in Figure 2. However, for a rough overview of the project activities, milestones, and tasks allocation, Table 1 was structured 8).
| Task | Responsible |
|---|---|
| Initial Research & Planning | |
| Task Allocation | The Team |
| Gantt Chart | João |
| Principle Research | Marie & Daniel |
| Competition Research | Nacho & João |
| Features & Possibilities Research | Elisa & Pascal |
| Specific Planning | |
| System Diagram (Black Box) | Elisa |
| Structural Drafts | Marie |
| Design | Marie |
| List of Materials | Elisa & João |
| Interim | |
| Project Management | Pascal |
| Marketing Plan | Elisa & Nacho |
| Sustainability Concerns | Marie |
| Ethical Concerns | Daniel |
| Construction | |
| Coding the Software | Pascal |
| Assembly of the Materials | The Team |
| Circuit Assembly | João & Pascal |
| Testing | |
| Functional Tests | |
| Electronics Tests | João & Pascal |
| Corrections | |
| Final | |
| Final Report & Presentation | The Team |
| Poster, Paper, Video, Leaflet | The Team |
| Review of the Wiki Contents | Elisa |
1.8 Report Structure
This report is divided into 8 chapters. Table 2 displays that organisation and structure.
| Task | Description |
|---|---|
| 1 | Introduction |
| 2 | State of the Art |
| 3 | Project Management |
| 4 | Marketing Plan |
| 5 | Eco-efficiency Measures for Sustainability |
| 6 | Ethical & Deontological Concerns |
| 7 | Project Development |
| 8 | Conclusions |
| Appendices | |
| Bibliography |
2. State of the Art
2.1 Introduction
In this chapter, the objective is to do an initial research before developing the actual product or solution. It is about the basic working principle of solar dehydrators, the current market situation in relation to them, and the possible features and functions that can be added to the system. The team started doing a brief study about existing products in the market for personal or industrial use and the different technologies that already exist for electric and solar dehydrators in order to define the path and finally saying how the product should be, starting from the materials and continuing with the system, electronics, and design.
2.2 Everything you need to know about the Solar Dehydrator
To introduce the product, a solar dehydrator is a device that uses solar energy to dry food, wood or even clothes. The principal function of a solar dehydrator is to dehydrate, which consists in extracting the moisture of a body, food product or material. Modern dehydration techniques have been motivated by all the advantages that dehydration has, such as compactness (dehydrated food has about 1/15 of the bulk of the original product), or, as bacteria and molds need water to grow, the fact that the product will not rot because microorganisms cannot grow when food is sufficiently dehydrated.
2.2.1 Components of the solar dehydrator
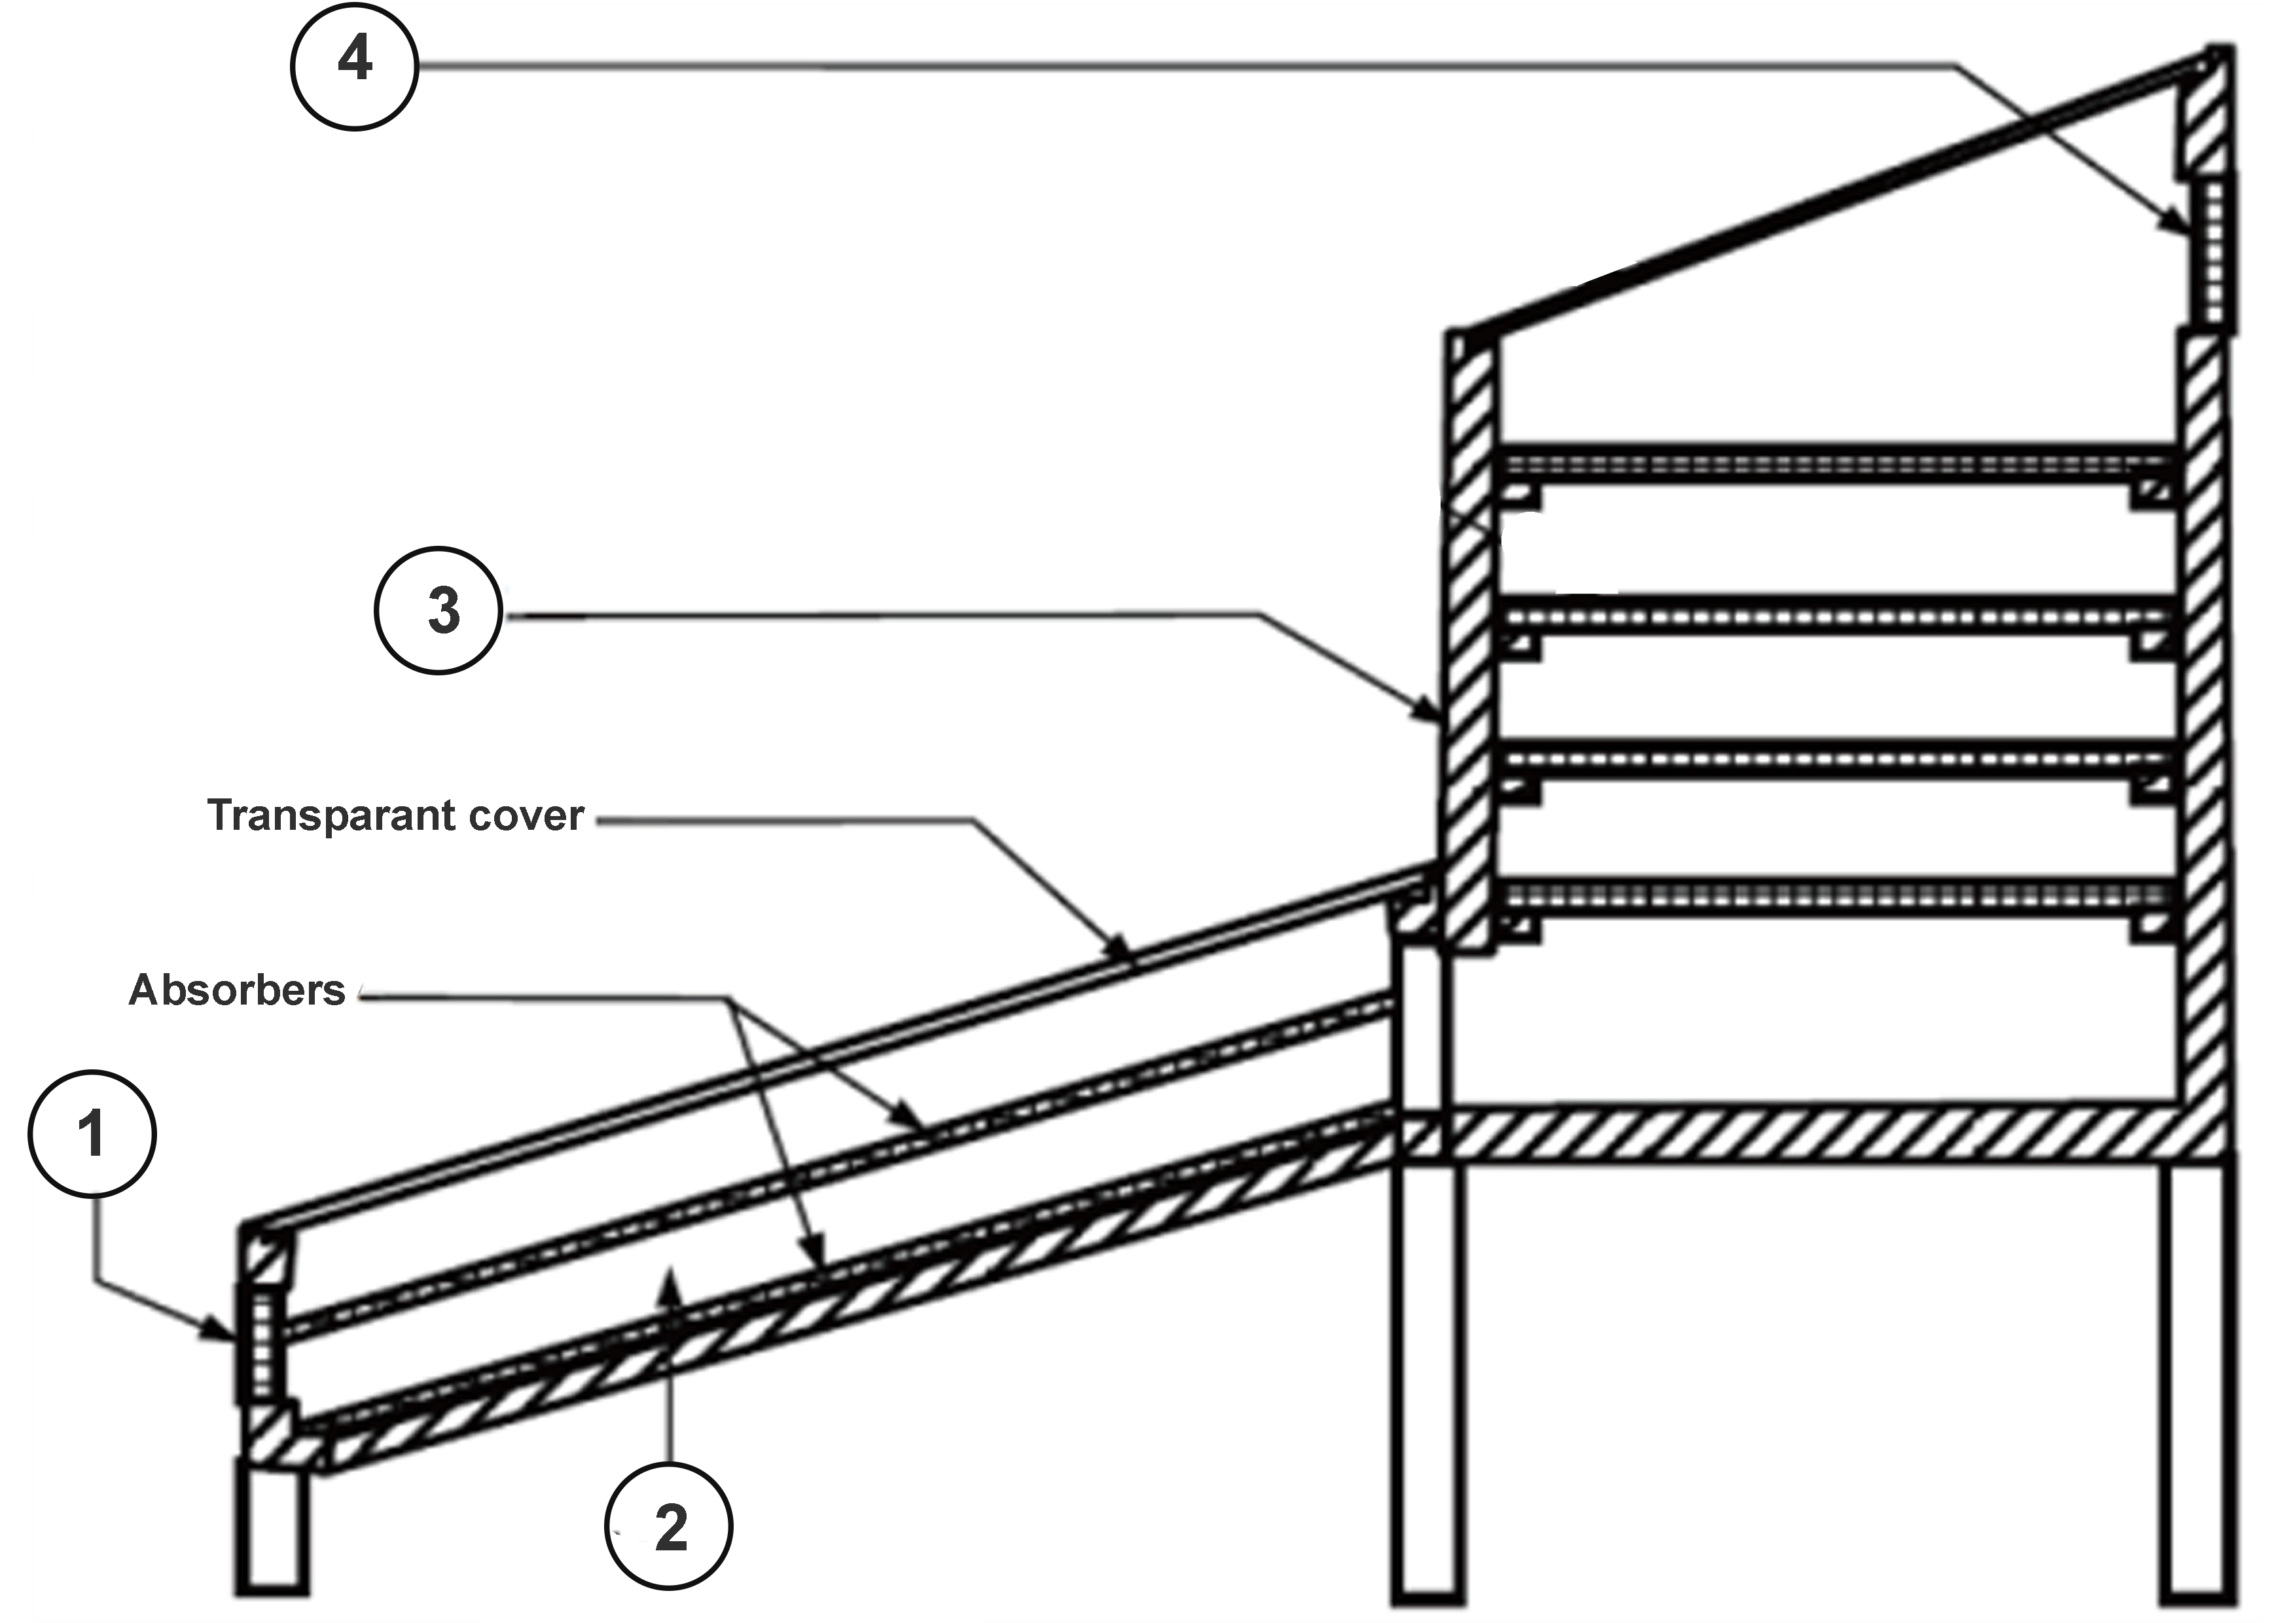
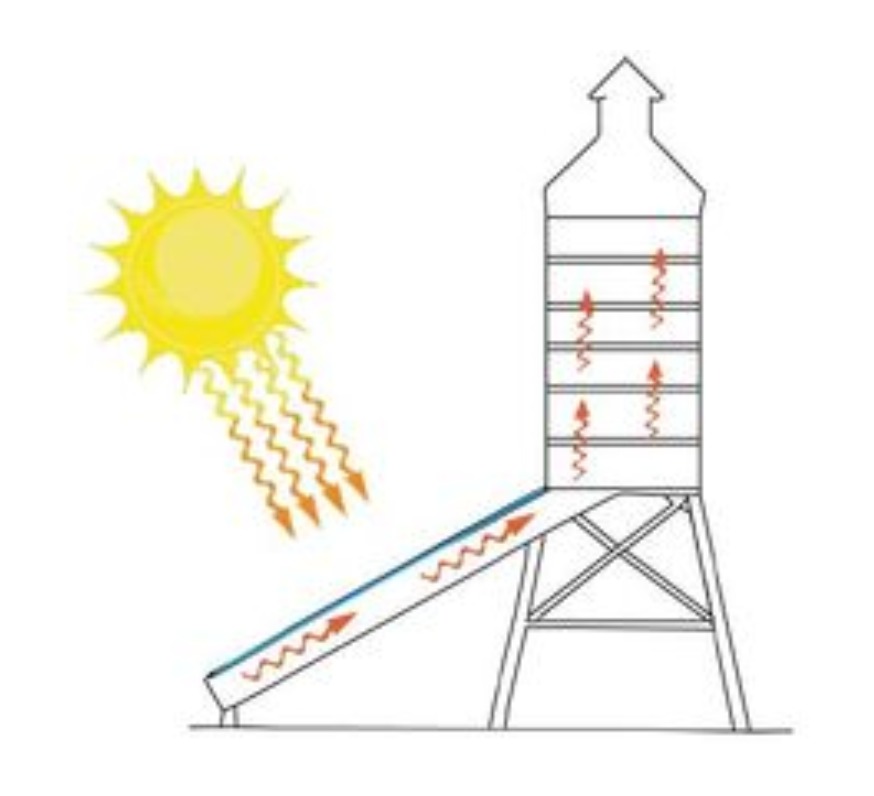
There are 4 main components in a solar dehydrator 9) that are described below and in Figure 3.
- The air intake, that will provide fresh air from outside for the drying cabinet
- The air heater or solar collector, which is a box that heats the fresh air. It is a box with a transparent cover on top and inside it is some absorbers, that is to say, black surfaces to capture the Sun's heat more easily
- The drying cabinet, which is a place where you put the raw food that you will dry
- The air outlet, that is necessary to let escape the moist air
2.2.2 Drying process
The process of drying can be described in four steps 11):
Step 1: The fresh air flows into the solar collector.
Step 2: The absorbers ensure that the fresh air warms up by the heat of the Sun. The hot air then rises and flows into the drying cabinet.
Step 3: The intake of the hot air increases the temperature in the solar cabinet. The high temperature ensures that the vapor pressure of moisture inside the food increases and that the relative humidity of the air around the food decreases. Because of the lower relative humidity of the air, the air should capture more moisture from the food. The moisture-carrying capacity depends on the pressure and temperature of the air. The higher the temperature, the higher the moisture-carrying capacity.
Step 4: The moist air flows away through the air outlet.
2.2.3 Types of solar dehydrators
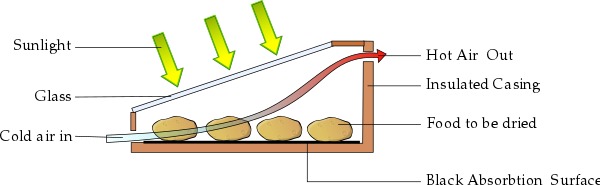
Direct type
In this case, the solar radiation impacts directly the material to be dried, as shown in Figure 4. The material to be dried is placed in an enclosure, with a transparent cover of glass or plastic on it (Plate 2A). The Sun's heat acts on the material and enclosure and causes a heat build-up due to the “greenhouse” effect. Thus, the temperature inside the chamber rises. The glass or plastic cover serves one more purpose of reducing direct convective losses to the environment, which further becomes beneficial to raise the temperature of the product and the chamber respectively. The collector and drying chamber are usually painted black to absorb the maximum amount of heat. However, convective and evaporative losses occur inside the chamber from the heated material. Direct solar dryers are cheap to make and easy to use. However, it does not allow temperature control. It is hard to protect the product that is drying from external factors. Furthermore, many fruits and vegetables may change color and lose many vitamins if they are exposed to sunlight for too long 12) 13).
Indirect type
In indirect solar dryers, solar radiation doesn't impact directly the material to be dried. The air is heated in a solar collector and then ducted to the drying chamber to dry the product, Figure 5. As the hot dry air stream passes through this unit, it removes the moisture of the product. It is possible to control the temperature with this kind of dryer, thus, a better quality of the product is obtained than in a direct dryer. Moreover, since the product is not exposed to ultraviolet (UV) radiation, the color and texture remain unchanged. The solar radiation produces heat within the bulk of the product upon penetration through its porous skin and changes the color and texture. However, indirect dryers are more expensive to make and harder to use 14) 15).
Mixed type
These dryers combine direct solar radiation onto the transparent cabinet, and preheated air in a separate solar collector to provide the heat required for the drying operation. As visible in Figure 6, the cabinet and the solar collector case are both transparent in order to have the maximum amount of solar radiation use. The product is drying the food that is put in there to dry simultaneously by both radiations with downward conduction of heat and the convection of heat from the solar air heater. This principle combines the two methods' advantages and dries food faster, however, it also affects the food by getting exposed to the UV of the Sun 16) 17).
Hybrid type
The hybrid type of solar dehydrator can be thought of like a modern version of the solar dehydrator that is typically done as a hobbyists garden project. In this type, other sources of heat energy such as fan powered by solar PV are used to supplement solar heat and allow for a faster rate of drying, Figure 7. The combination of solar energy with other technologies increases the system efficiency and provides the advantage of continuous drying even during nights or in the cloudy day. Even though an extra cost is involved with extra technology, hybrid dryers provide benefits of reducing drying time, labor cost and improving the final quality 18) 19).
2.2.4 Reasons for dehydrating food
Dehydration is a good way to preserve food for the future. There are many reasons why people like dehydrating food: it’s safe, it’s easy, and it’s cheaper than buying dehydrated food. Better yet, the food itself is more nutritious, it is lightweight, doesn’t take up much space, and some of it is absolutely delicious 20).
Preserve food
- Economic part: dry food in the season when the food is very cheap (seasonal food) and then preserve it the whole year
- Reduce food waste in periods of overconsumption
- Longer storage duration
Keep healthy / nutritive value
- Large quantity of vitamins, fiber, mineral, and carbohydrates
- Reduced amount of fat
- Improved quality of food
Easy to transport
- More compact because of size difference afterward
- Doesn’t need special infrastructure → reducing energy
Less energy consumption and storage space in comparison with freezing
- Mitigates consumption of conventional sources of energy like fossil fuels so they allow reducing CO2 emissions
In comparison with food dried directly by the Sun
- No degradation of materials
- Clean (no access for dust, rain, wind)
- Keeps animals and insects away from food
2.2.5 Parameters which affect the performance
It is important to be careful about which fruits or vegetables will be dried because they have different contents of moisture which demand different working methods.
| Product | Moisture content Initial (%) | Moisture content Final (%) | Max. allowable temp. (°C) | Drying Time (h) |
|---|---|---|---|---|
| Apples | 82 | 11-14 | 60 | 15 |
| Apricots | 85 | 18 | 60 | 28 |
| Bananas | 80 | 15 | 60 | 10 |
| Carrots | 70 | 5 | 55 | 48 |
| Cherries | 60 | 21 | ||
| Cranberries | 60 | 12 | ||
| Figs | 70 | 20 | 60 | 30 |
| Grapes | 80 | 15-20 | 60 | 30 |
| Green beans | 70 | 5 | 55 | 48 |
| Green peas | 70 | 5 | 55 | 9 |
| Kiwis | 60 | 15 | ||
| Onions | 85 | 6 | 55 | 48 |
| Onion flakes | 80 | 10 | 55 | 24 |
| Peaches | 85 | 18 | 60 | 16 |
| Pears | 60 | 16 | ||
| Pineapples | 80 | 10 | 60 | 48 |
| Plums | 85 | 15 | 60 | 30 |
| Strawberries | 60 | 15 | ||
| Tomatoes | 95 | 7 | 55 | 36 |
| Water melons | 60 | 10 |
In order to increase efficiency and reduce the waiting time, it is essential to comprehend the factors that may affect the process. Next, 6 parameters that affect the performance of the drying process were exposed 22).
a) Type of food
Every type of food has a different allowable maximum temperature and drying time which can be seen in Table 3.
b) Amount of dried food
The more food you have in the drying cabinet, the more dried air you need. A bigger amount of food will increase the risk of obtaining poor quality dried food. By putting less food in the drying cabinet the drying rate of the solar dehydrator increases but sometimes this may cause a loss of energy.
c) Pre-treatment of food
If the food is well pre-treated before starting the drying process, the required drying rate and the drying time will shrink. Pre-treating the food consists in:
- Sorting (use young, tender, not too ripe and of good quality fruits and vegetables)
- Cleaning (remove sand, dirt, toxic products)
- Peeling (remove roots, stems, damaged parts)
- Cutting (improve the evaporation surface, avoid degradation, for example: quarters, slices, etc.)
- Bleaching (cook for a very short time in boiling water, guarantees quality and conservation as well as increasing the speed of dehydration).
d) Temperature
A higher temperature inside the drying cabinet rises the drying rate and decrease the drying time, only if the moisture content is high. If the moisture content is low, the temperature level doesn't result in a significant improvement.
Controlling the temperature is very important when drying different type of food in one machine because every type of food has its own characteristics in terms of temperature and drying time.
e) Airflow rate
The air may not have sufficient contact time with the product to remove moisture so the efficiency of heat solar dehydrator will increase. But an insufficient airflow rate will increase the drying temperature and slows down the drying process.
It is necessary to find the right balance for the airflow taking into account the other parameters like temperature.
f) Relative humidity of air
The drying duration becomes shorter when the air has low humidity. If the relative humidity of the air is high, a higher amount of energy is required so the drying rate is slower.
2.2.6 Condensation Solutions Research
A solar dehydrator is considered to be operating in its best condition when the Sun is at the right angle and heating up the collector significantly much. When working with temperature and water, the team has to consider what to do when condensation appears. This becomes especially important when trying to keep the heat inside the cabinet because the product has to extract water from the food and get rid of it by transporting it through a chimney out of the cabinet without condensing. The next list of questions takes this matter into perspective and will clarify the obstacles the project members could face when working with heat 23).
Where does the moisture come from?
- From the food that dehydrates,
- From the outside air,
- Water molecules that absorb energy in form of heat:
- at a certain level (temperature/energy) the molecules distance themselves from each other,
- evaporate and become lighter than the air molecules.
When does the moisture/humidity turn into condensation?
- When the evaporated moisture enters in contact with something significantly lower in temperature. For example, a cooking pan with water is placed next to a glass plate which is at room temperature (20 °C). The steam from the boiling hot water (about 100 °C) touches the glass. The evaporated water molecules give their energy to the glass plate and turn from gas form to liquid form with their surface tension holding them on the glass plate as drops.
How to reduce condensation? 24)
- Heat up every material inside the system in order to have no temperature difference and thereby no energy difference. The water stays evaporated.
- Significant amount of energy is needed in order to do that (initially).
- After heating everything up it should stay heated.
- Solution: Isolation in order to preserve the produced heat and reduce condensation
Where to go with the evaporated water?
- “Heat always travels up” (convection principle)
- Try to let the humid air only move up
- Solution: fans lightly moving the molecules up
2.2.7 Evaporation Research
The goal is to dry food inside of the cabinet without cooking or steaming it, therefore, the solar dehydrator needs to have a temperature limit.
“There are three key parts to evaporation: heat, atmospheric pressure (determines the percent humidity), and air movement.” See Table 4 for the outcome 25).
More or less evaporation:
| Condition | Rate of evaporation |
|---|---|
| Humidity | Nonproportional |
| Flow of Air | Proportional |
| Pressure on Food | Nonproportional |
| Surface Area | Proportional |
| Higher Temperature | Proportional |
2.2.8 Airflow techniques
In order to take full advantage of the airflow to originate mass transfer, see the importance in Appendices, it's crucial to understand what is considered the most fundamental principles.
- An air mass flow rate of 0.035 kg/m²s was optimal for drying most agricultural products 26)
- Optimal temperature range for drying these same products was 45.5-55.5 °C 27)
- An increase in airflow in a collector increased the efficiency of the conversion of solar energy into more usable forms of energy at the expense of a drop in air temperature 28)
- Increasing the height of an added chimney improved the thermosiphoning abilities of the dryer 29)
- Airflow in a convective air system is directly linked to change in air density due to temperature, the thermosiphoning abilities of the dryer and airflow are proportional 30)
- An increase in surface roughness of collector material caused a pressure loss along the airflow line suggesting that the airflow had been impeded with a consequential decrease in dryer efficiency 31)
- Increasing the depth of the product in the dryer bed decreased the airflow rate and thus decreased the efficiency of the collector 32)
Important note: A smaller number of trays would decrease the drying time and the total product output, while a higher number of the tray would decrease the throughput while increasing the drying time 33).
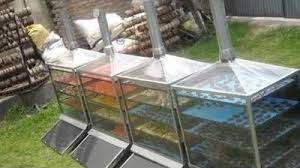
2.3 Existing Solutions
In this subsection, already existing solutions, and, consequently, competitors will be introduced and explained.
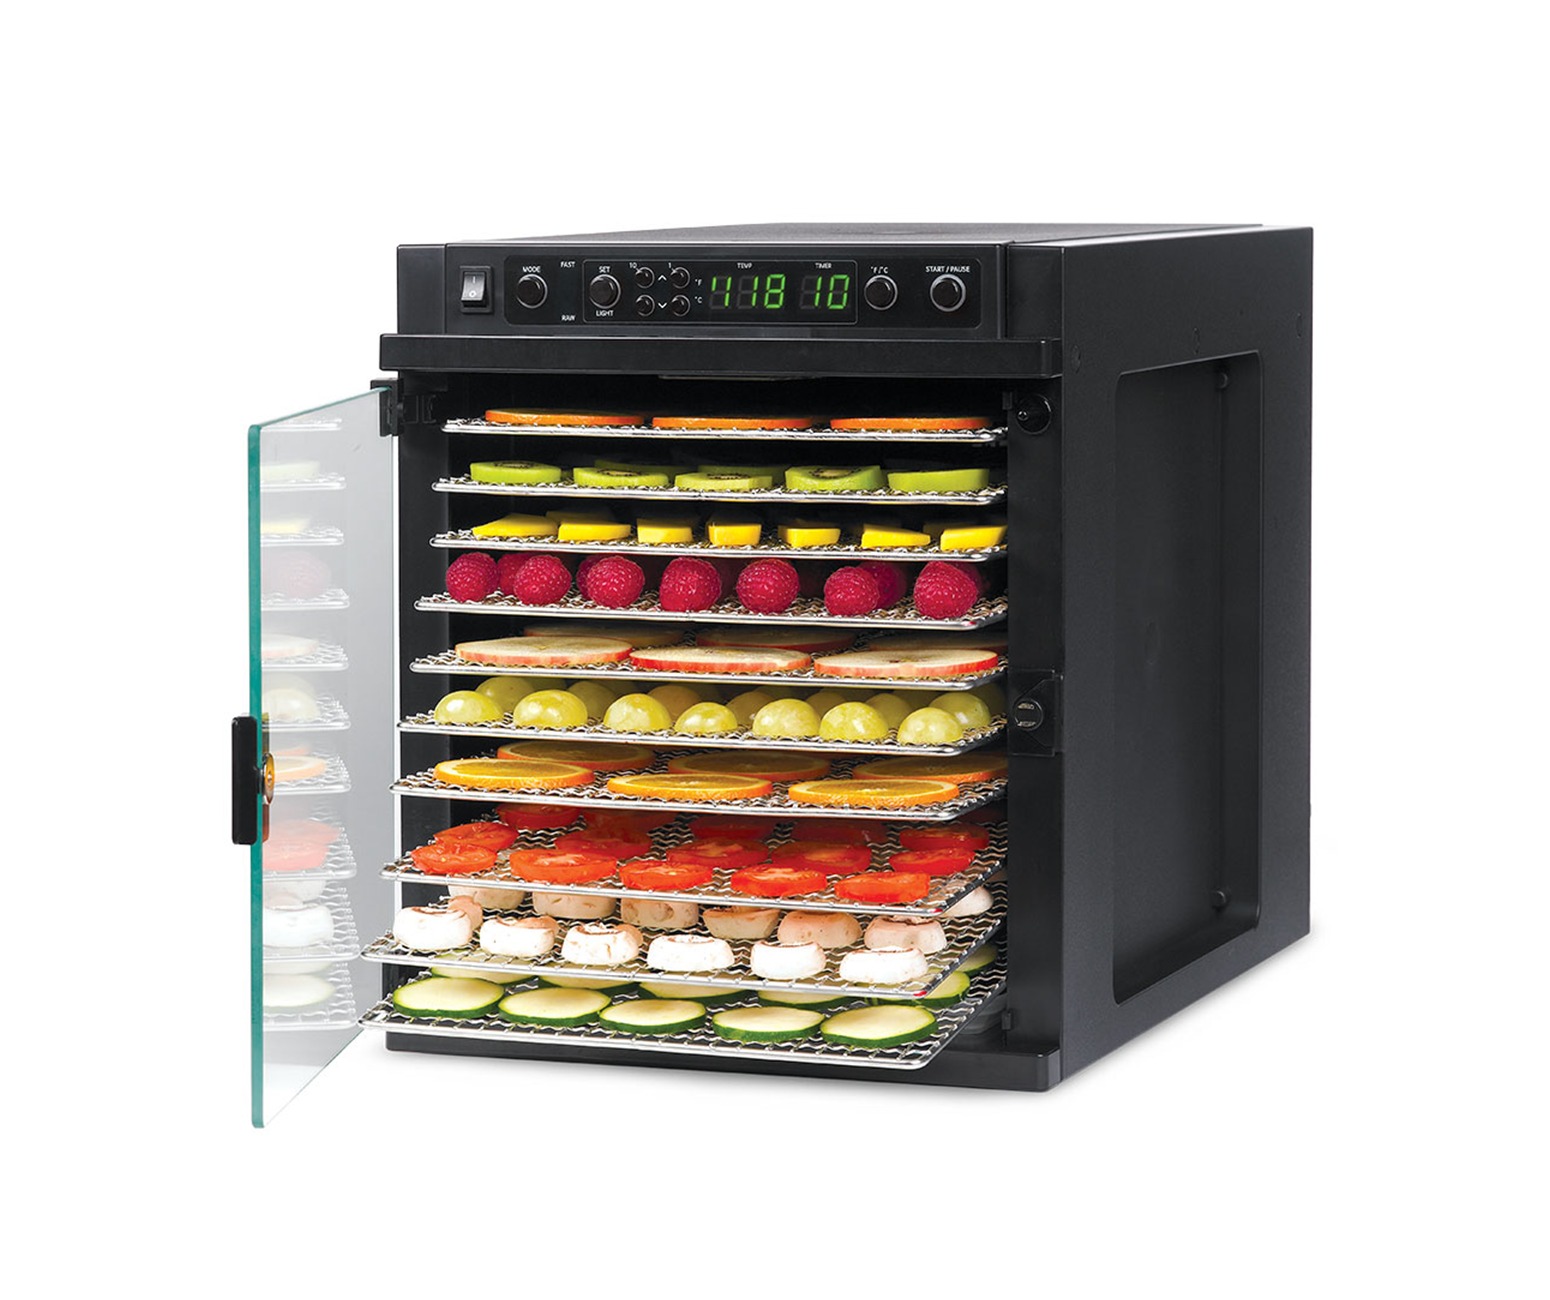
2.3.1 SEDONA Express Metal Dehydrator
Electrical dehydrator
Characteristics 34):
- Compact design that fits in any kitchen
- 11 stainless steel trays to dehydrate
- 1 closed tray for easy cleaning: it is placed below and collects everything that may fall from the trays. It is removable - and easy to clean
- 3 dehydration programs: FAST (fast), RAW (at low temperature) and COMBO (through the TST System: sequential control of the temperature in two phases - “Two-Stage Sequential Temperature”)
- Digital control panels, which facilitate their use
- Digital temperature selector from 25 °C to 75 °C, to program temperatures grade to grade
- Timer, for automatic stop, up to 150 hours
- Air filter to filter particles. It can be washed and re-used, plus it comes with a spare one
- Glass door with hinges to be able to see inside and to put in and take out trays with ease
- Interior light: LED
- Silent operation
- The manufacturer recommends using it 10 cm away from other appliances or furniture
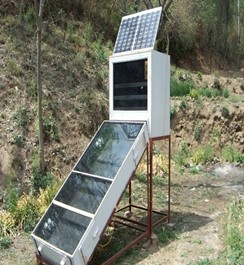
2.3.2 ZEFIRO-SOLAR Food Dehydrator
Solar dehydrator
The Zefiro Max or Tunnel is about 6 meters long. The entire roof is made up of Menegatti panels. Fans draw warm, dry air through the units during the day and cooler, moist air at night. Where electricity is available, the Zefiro only needs 50 W of power, less than one 60-watt light bulb, whereas the Zefiro Max requires 500 W of electrical power. 36) (Figure 9)
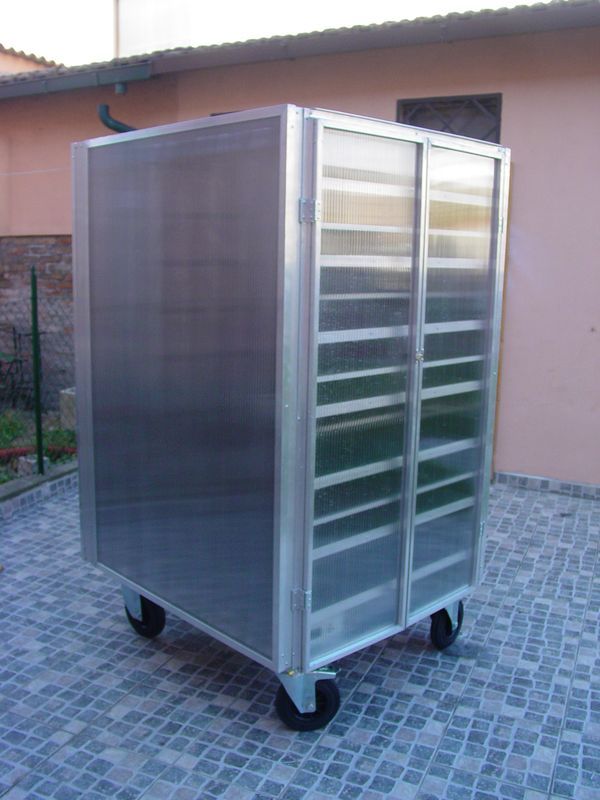
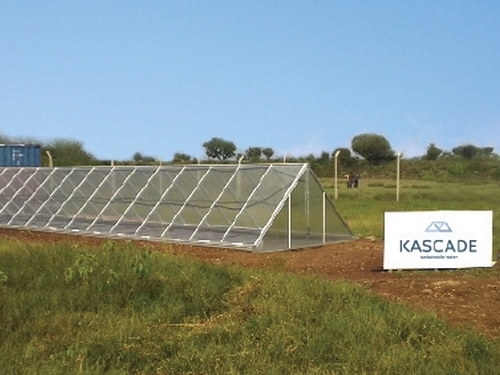
2.3.3 Kascade Solar Dryer
Solar dehydrator
Kascade developed a modular drying system, made from first-class materials like aluminium and glass. The Kascade “Solar Dryer” is equipped with special rolling “Cassette Trolly’s” to transport the materials through the dryer and to make on/offloading of products quicker and easier. Drying Omena fish, mangos, bananas, etc. takes approximately 4 hours. The size of the “Solar Dryer” can be adapted to the number of products which need to be dried. The Kascade “Solar Dryer” can be built and removed without leaving a trace. All materials can be recycled and there is no waste involved in the process of drying. No fossil energy needed.
Human waste is available in abundance, but unfortunately, it causes problems in many areas due to lack of proper treatment. It is possible to turn this waste into energy, simply by drying it. By one estimation, a single American’s daily sludge output can generate enough electricity to light a 60-watt bulb for more than nine hours. The Kascade “Solar Dryer Tunnels” are equipped with rolling drying tables to transport the materials through the dryer. After the material is dried it is ready to use, either as fertilizer or as a base for fuel 38) (Figure 10).
2.4 Possible Features & Components
This topic has been a creative process of brainstorming for many features and add-ons on the actual solar dehydrator. It might contain some non-realistic ideas which are only part of the brainstorm. Furthermore, most of these possible components need to be discussed and be weighed against the range of necessity and luxury. Therefore, this is only an overview to sort every matter that could be part of the final solution.
Sensors
- Humidity sensor
- Light sensor for detecting day and night or too much light input
- Temperature sensor for detecting if the solar panel needs to be closed or opened more
- Airflow sensor
- Battery level sensor
Electronics
- Fan for bringing fresh air in and moisture out
- Electro-mechanical opening and closing lids (for bringing in fresh air or isolating the chamber)
- Battery pack
- Control unit (Arduino, Atmega, Raspberry Pi)
- Solar panel + converter unit
- User interface (display, touch display, keys, buttons or knobs)
Case
- Case materials (sustainable materials, re-used materials, wood, plastic, polymer, etc.)
- Case form (cubic, cylinder, etc.)
- Traying possibilities (plate, grills (steel grills), hanging hooks, something like a fishing net, rotating or static trays, square or round trays)
- Movement (rotating joint to follow the Sun, winding up the system and let it be a counter like a kitchen timer for cooking, wheels under the construction to be able to move it around)
Others
- Angle of the solar-heat collector (maybe extending legs of the system)
- Colour for the solar heating platform
- Coating material against different weather conditions
- Solutions against condensed water (double layered isolation, look at solutions condensation, salt to the system against humidity and moisture)
These components and ideas were all thought about during the brainstorming process. In the course of the development phase, many of these points can be neglected due to budget or necessity reasons.
2.5 Conclusion
As seen in these three sections, there are a lot of ideas and possibilities available to make this project as interesting as it can be. The competition, either, does not think of sustainability when thinking of a home use dehydrator or does not develop a product you can have inside your house. This gave the team the opportunity to combine both. The four different types of solar dehydrators are narrowed down and the team chose to make an intelligent hybrid indirect type.
There are advantages like:
- protecting the food from direct UV radiation
- the electrical power in order to get more monitoring abilities
- being able to add more electronics and expansion features that are stated in future developments
- a guided and speed up drying process with fans and sensors
Based on this study of the state of the art, the team decided to adopt the following components to the final solution:
- Solar panel
- Power converter
- Battery
- Control unit (e.g. Arduino)
- Ventilation fans
- Temperature sensors
- Humidity sensors
- Cables
- Hinges for cabinet doors
- Fiberglass mesh (trays)
- Plywood (case)
- Anti-insects mesh (in- and outtake)
- Polycarbonate (the transparent part above solar collector)
- Black sustainable paint
For all specific quantities, component numbers and visual help, see the list of materials and components (Tables 6 and 7) in 3.3 Costs and the design ideas.
With this research, the team concluded that it is important to comprehend how the project has been and will continue to be managed according to the standards covered in the next chapter.
3. Project Management
3.1 Scope
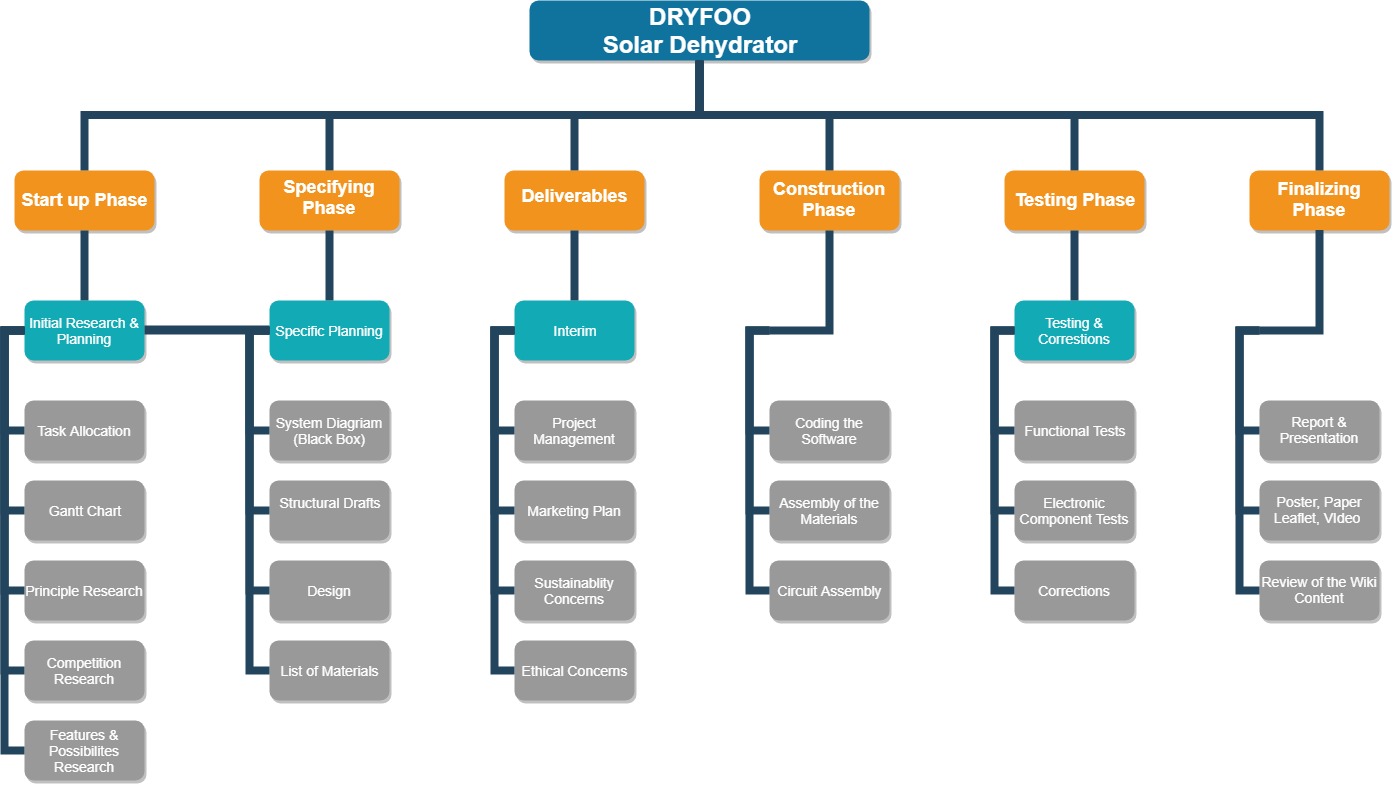
Having a field that is defined and limited to certain activities, goals, and achievements is an essential part of the planning. This comes in handy when the team needs to stay on track and wants to avoid doing too much or not enough in a project. In Figure 11 the scope of the whole project is displayed roughly in phases and deliverables. As seen in the “Start-up Phase” and the “Specifying Phase” there is a connection between the two. The reason behind this is some overlapping activities and goals that rely on each other or need to be corrected/changed after a certain deadline hit.
Next, to that, the scope is normally defined after discussing all the different types of requirements that the project is about and the solution will have. However, the fact that this project is part of the EPS means that the supervisors have generally predefined the scope of this project by laying out a list of deliverables that can be seen in the time management chapter below.
This means that the scope is packed with activities, deliverables and plannings that normally take more time than a single semester and will eventually be the cause of less focus on the actual final solution.
3.2 Time
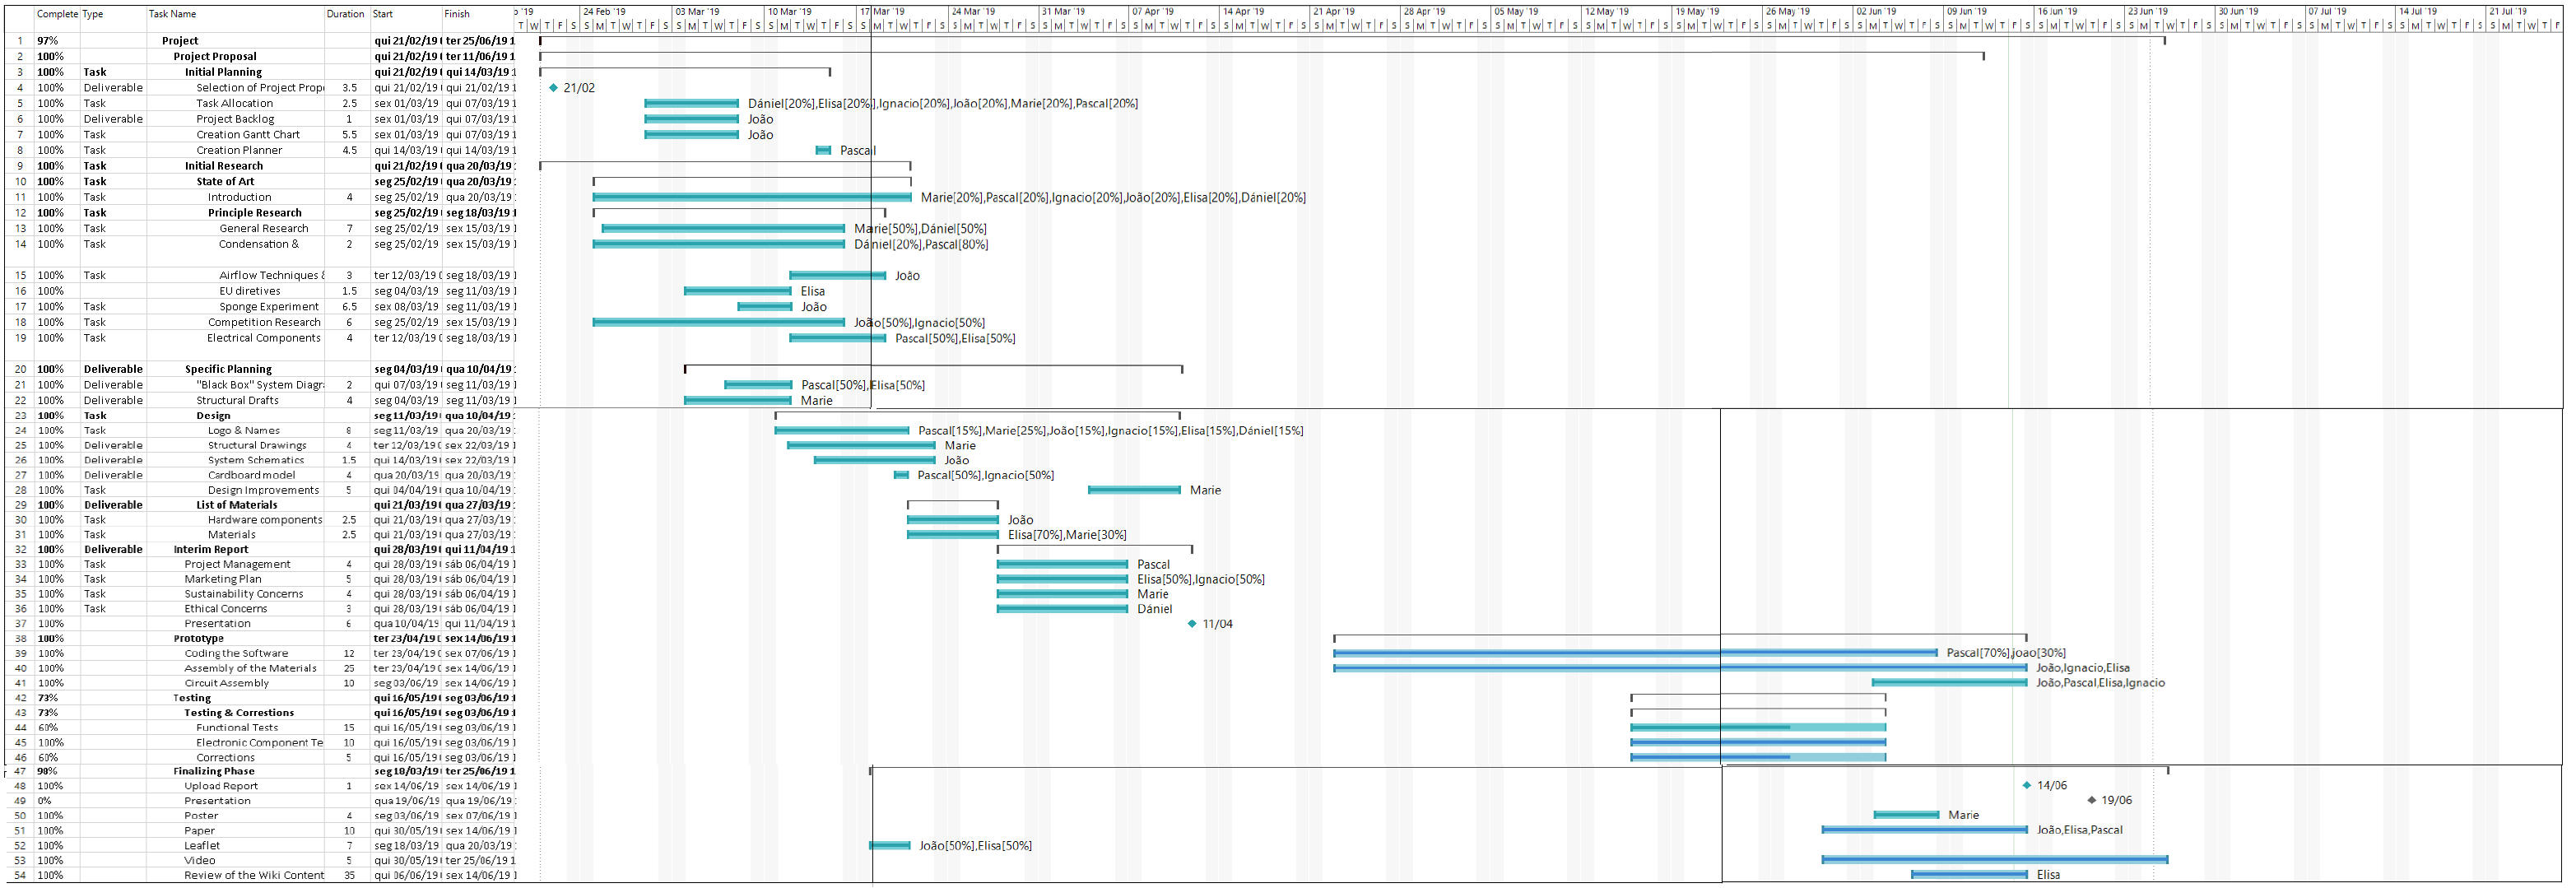
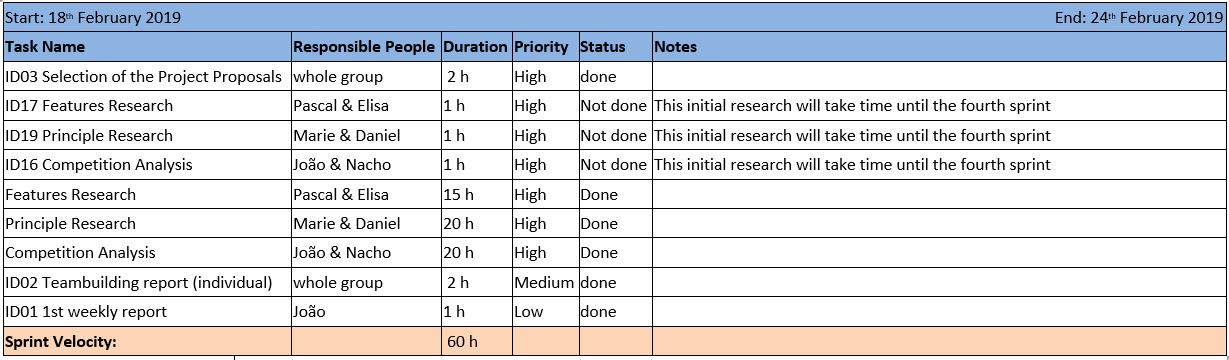
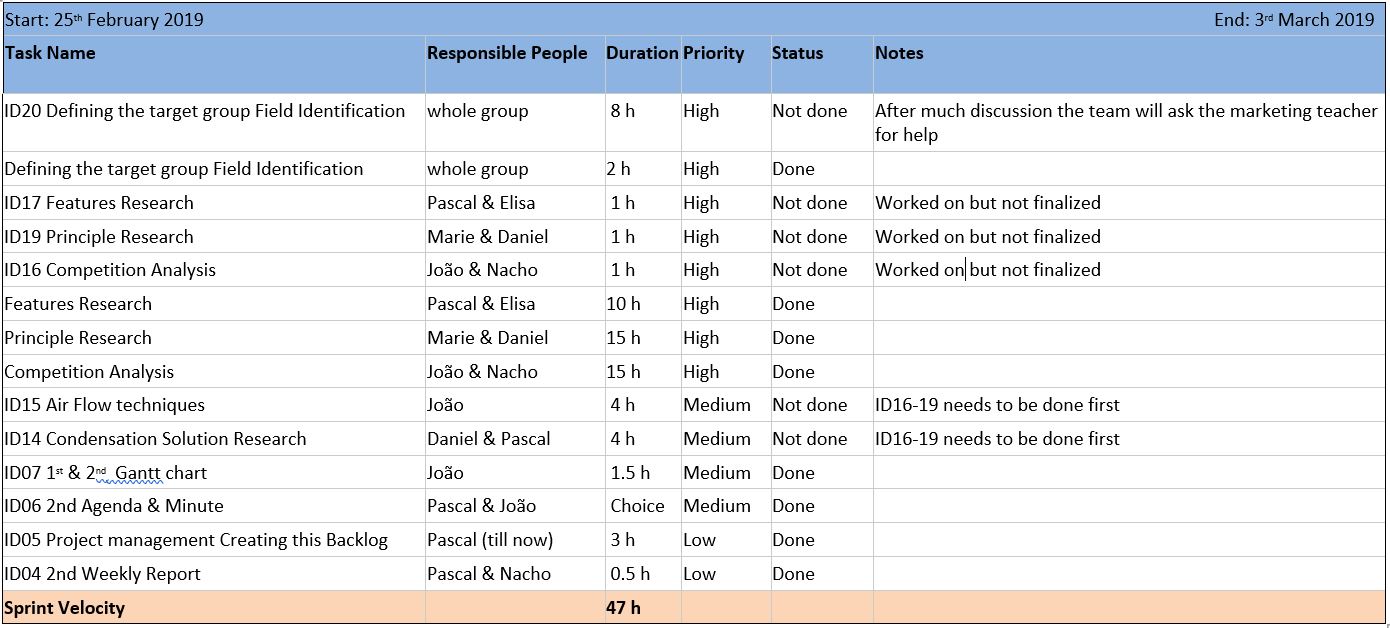
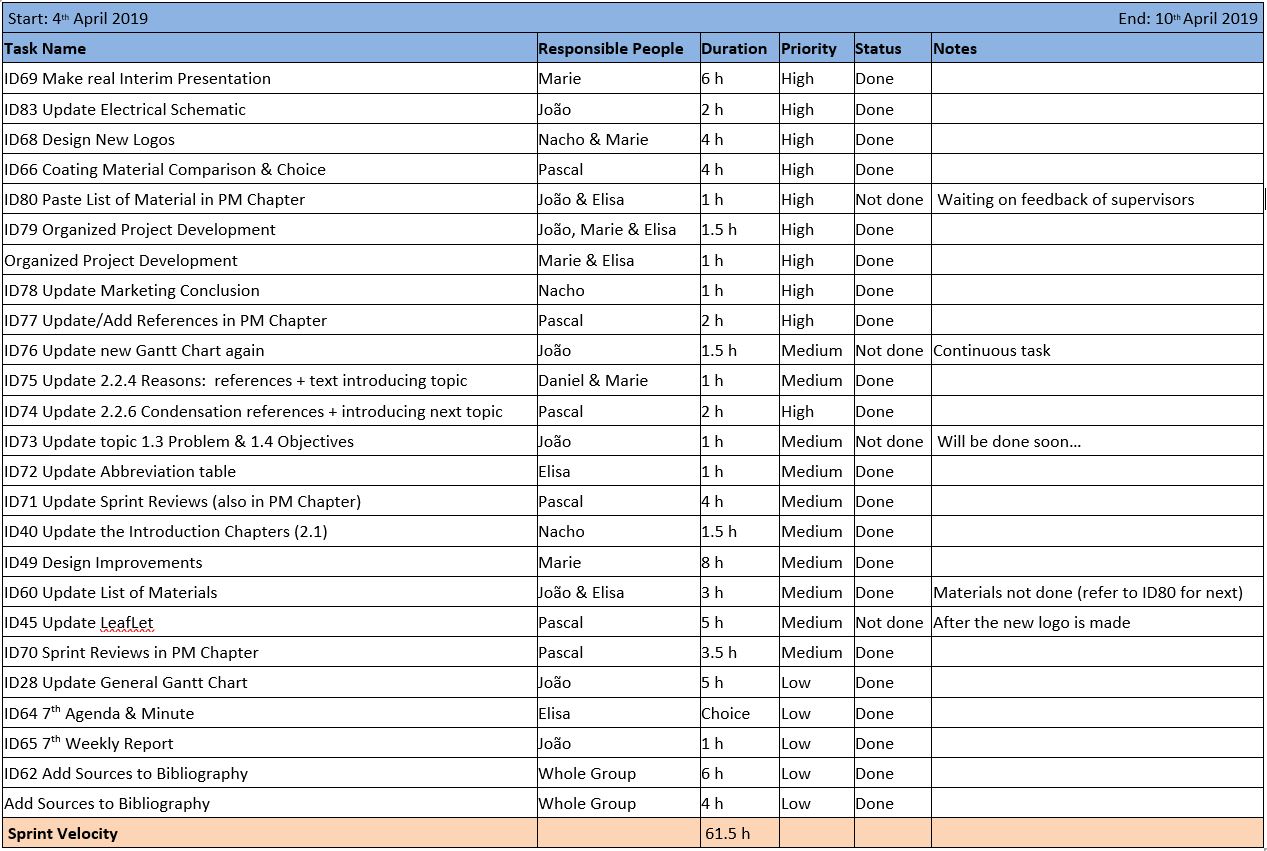
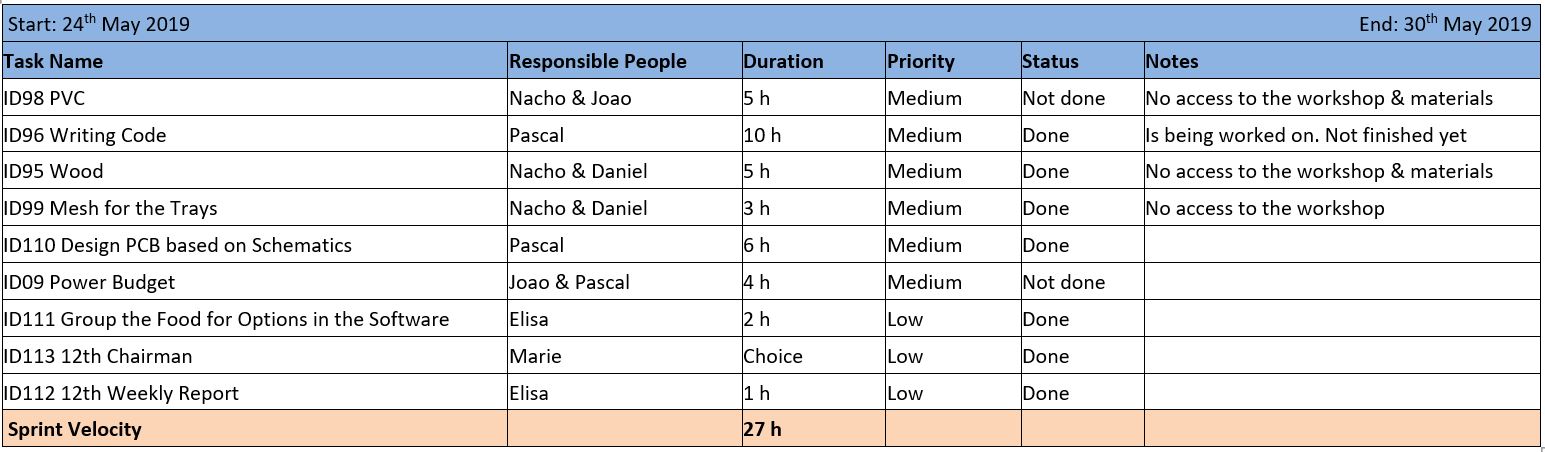
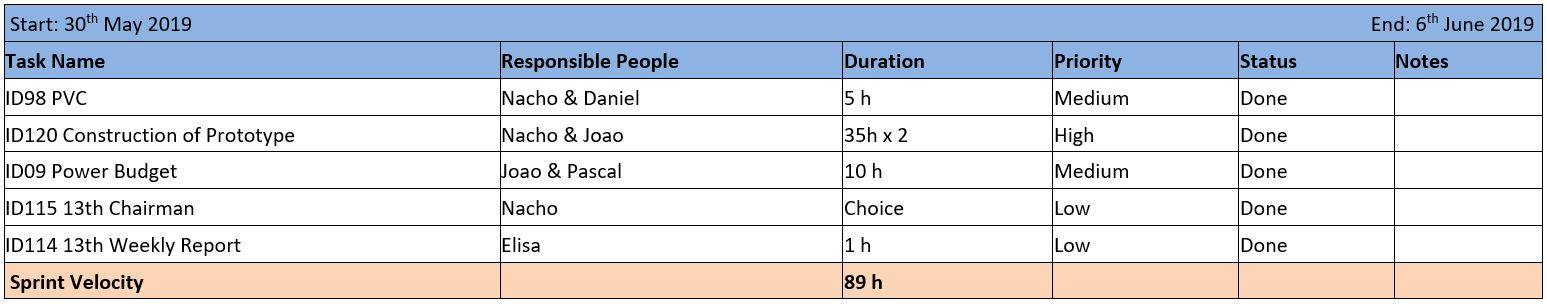
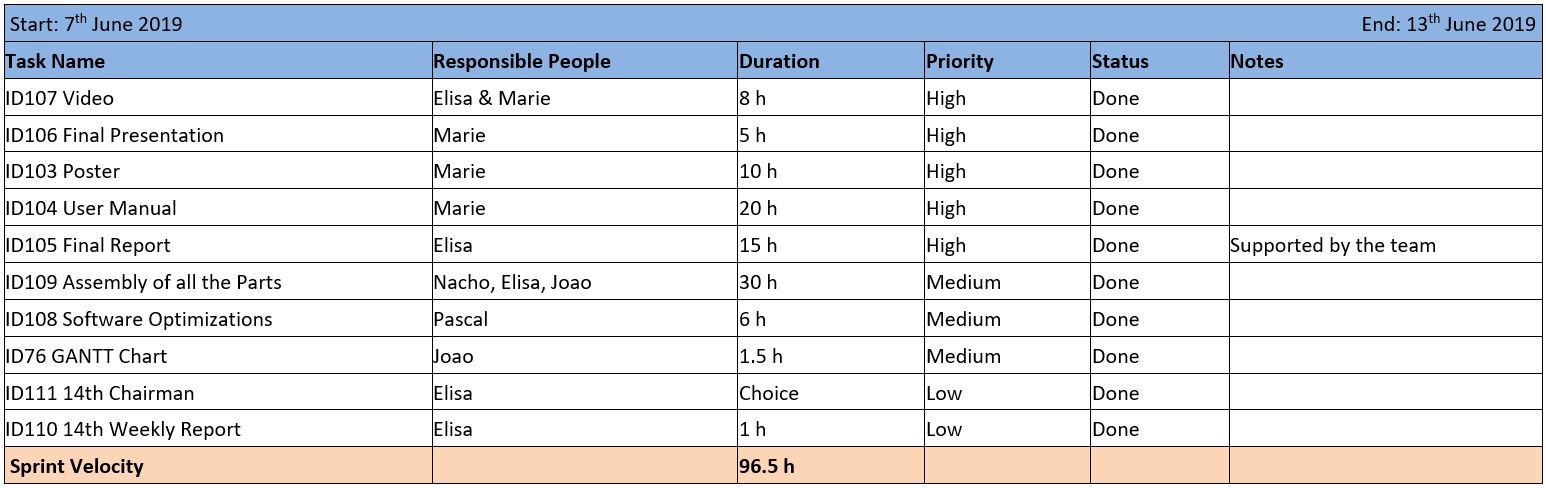
Time is the second most important key part of managing the project. Of course, the team has deadlines in order to be on time and has a fixed point of time management. A Gantt chart has been created which contains the tasks, time and resources needed of each activity, as shown in Figure 12. This graph helps to control & monitor the project advancement and manage the available time in the most classical way, for example, to speed up working velocity when they notice they are behind. Thanks to Table 5, the team knows the current tasks and the deadlines of the next deliverables. It is also another way to do tasks in the order they need to be done. These two illustrations should help to get the time management in order.
| Deadline Dates | Description |
|---|---|
| 2019-02-25 | Choose a project proposal |
| 2019-03-06 | Define the Project Backlog, Global Sprint Plan, Initial Sprint Plan and Release Gantt Chart of the project |
| 2019-03-11 | Upload the “black box” System Diagrams & Structural Drafts to the wiki |
| 2019-03-22 | Upload the detailed System Schematics & Structural Drawings to the wiki and do the cardboard scale model of the structure |
| 2019-03-27 | Upload the List of Materials (what & quantity) to the wiki |
| 2019-04-06 | Upload the Interim Report and Presentation to the wiki. |
| 2019-04-11 | Interim Presentation, Discussion and Peer, Teacher and Supervisor Feedbacks |
| 2019-04-23 | Complete the List of Materials (local providers & price, including VAT and transportation) to the wiki |
| 2019-05-30 | Upload refined Interim Report (based on Teacher & Supervisor Feedbacks) |
| 2019-06-03 | Upload the results of the Functional Tests to the wiki |
| 2019-06-14 | Upload the Final Report, Presentation, Video, Paper, Poster and Manual |
| 2019-06-19 | Final Presentation, Individual Discussion, and Assessment |
| 2019-06-25 | Update the wiki, report, paper with all correction suggestions |
| Hand into the EPS coordinator: a CD with the corrected deliverables (source + PDF) together with all code and drawings produced | |
| Hand in a printed copy of the corrected report and poster | |
| 2019-06-27 | Hand in the prototype and user manual |
However as one of the team’s teachers used to say, “planning in this (early) stage of the project is not advisable and only ends up in changing the plan later on”. Therefore, as mentioned in the scope section, the team uses the Scrum approach on time management. Instead of holding onto the whole GANTT chart for a whole semester, the tasks, goals, and activities are split into smaller chunks of time. One week is one sprint and a doable amount of work is done in that sprint. Nothing more, nothing less. This way the team can focus on that time on specific tasks and not worry about the future until the end of the sprint.
Next, to this time management approach, the project team is determined to do tasks as soon as they get recognized or given and not work towards deadlines. One of the key goals of the team is striving for faster response on a personal and work ethics level. Therefore, there will be more time to make corrections, have a low level of stress and get a higher working standard which results in a higher standard of quality (see 3.4 Quality). Although the complete time for the whole project planning and development is stacked into a semester which is, looking at the scope, not enough time to make a really thought through solution to the problem. However, the team has to work with it and makes the best out of it.
3.3 Cost
Time is money but without money, you won’t have time either. Therefore, calculating the costs of the project in advance is more important than the actual development of the product afterward. As for the costs, work resources and material resources can be differentiated. Both are important to the project. However, work resources won’t be important in this case because the team is made of students at a university and not paid employees.
- Work Resources
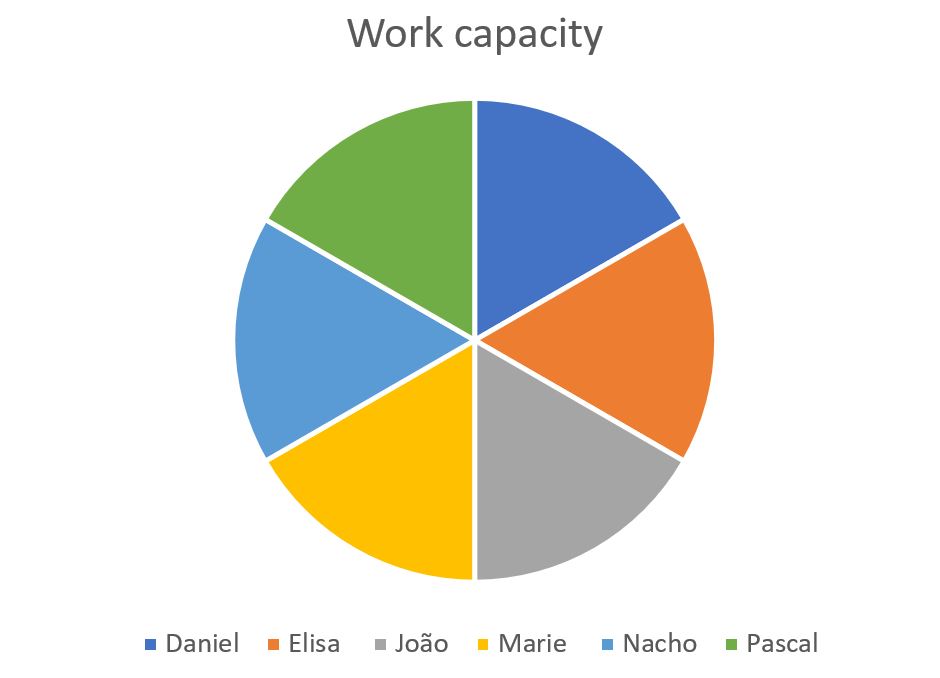
Work resource depends on the time and quantity of workers involved in the project. This budget is calculated on the hour cost and the duration on the worker work. But as the Team is in a school project, it is canceled from the budget even if it has been calculated theoretically. As seen in Figure 13, the optimal workload and, therefore, the costs on working hours should be evenly divided for every group member. This will make the amount of responsibility on everyone's shoulders even. Hence, each member can talk and discuss with each other on the same level as themselves. In theory, this is the best approach, however, this will differ in reality because of the difference between tasks and study background. As seen in 3.5 People, certain people are chosen for certain topics.
- Material Resources
A material resource is based on the price of each component and its quantity. Tables 6 and 7 display the lists of materials and their prices. To check the links and further details, the excel file is available in the deliverables section. These lists are made having as reference the budget of 100 €. Therefore, some components are also re-used, refurbished or second hand, if the institution's (ISEP) storage has some components to spare.
| Component | Voltage (V) | Current (A) | Power (W) | Price (€) | Quantity | Total Price (€) |
|---|---|---|---|---|---|---|
| Arduino Uno | 5 | 0.02 | 0.1 | 14.9 | 1 | 14.9 |
| Solar Panel | 6 | 0.2 | 1.2 | 10.75 | 1 | 10.75 |
| Battery | 3.7 | - | - | 3.9 | 1 | 3.9 |
| Battery Holder | - | - | - | 1 | 1 | 1 |
| Battery Charger | 5 | 1 | 5 | 1.95 | 1 | 1.95 |
| Voltage Booster | 5 | 0.6 | 3 | 3.5 | 1 | 3.5 |
| Fan | 5 | 0.15 | 0.75 | 3.95 | 1 | 3.95 |
| Servo Motor | 3.0/7.2 | - | - | 3.75 | 1 | 3.75 |
| Display LCD 2IC | 5 | - | - | 7.9 | 1 | 7.9 |
| Temp. and Humid. Sensor | 1.9/3.6 | 0.15 | 0.495 | 9.84 | 1 | 9.84 |
| Electrical Storage Box | - | - | - | 2.75 | 1 | 2.75 |
| Diode | 1.1 | 1 | 1.1 | 0.1 | 2 | 0.2 |
| LEDs | 2.1 | 0.2 | 0.42 | 0.15 | 3 | 0.45 |
| Wires (25 m) | - | - | - | 3.2 | 1 | 3.2 |
| Buttons | - | - | - | 0.15 | 2 | 0.3 |
| Resistors | - | - | - | 0.05 | 5 | 0.25 |
| Breadboard | - | - | - | 0 | 1 | 0 |
| Capacitors | 16 | - | - | 0.1 | 1 | 0.1 |
| Extension cable Servo | - | - | - | 1 | 1 | 1 |
| Transistors | - | - | - | 0.15 | 1 | 0.15 |
| Part | Material name | Area (m²) | Length (m) | Attributes | Price per m² (€) | Quantity | Total Price (€) |
|---|---|---|---|---|---|---|---|
| Transparent Front | PVC | 0.11466 | - | Bendable (< 1 mm) | 14.99 | 1 | 1.72 |
| Bended Front Rest | PVC | 0.125 | - | Bendable (< 3 mm) | 0 | 1 | 0 |
| Straights parts of the case | Wood (preferably plywood) | 0.62 | - | Width: 10 mm (depends on ISEP’s stock) | 2 | 1 | 0 |
| Trays and air holes mesh | Plastic mesh | 0.070125 | - | Provided by ISEP | 0 | 1 | 0 |
| Tray bars | Wood (preferably plywood) | - | 4.5 | 10 mm x 10 mm | 0 | 3 | 0 |
| Paint for Collector | Black paint (mat) | 0.07 | - | Provided by ISEP | 0 | 1 | 0 |
| Collector | Rubber | 0.09226406 | - | 50 cm x 25 cm | 3 | 1 | 3 |
| Screws | - | - | 0.02 | Pack | 2.56 | 1 | 2.56 |
| Glue | White wood glue | - | - | In a tube | - | 1 | 3.99 |
| Sliding lock latch | Stainless steel | - | - | Waterproof | 4.45 | 1 | 4.45 |
| Hinges (door) | Stainless steel | - | - | Waterproof | 1.99 | 2 | 3.98 |
| Isolation between gaps and connections | Silicone | - | - | - | - | 1 | 2.49 |
The total prices are as follow:
- Total price for electronics: 69.84 €
- Total price for other materials: 25.17 €
- Total Cost: 95.01 €
3.4 Quality
In order to achieve quality, the project group needs to look at different attributes of quality which are written in 3 topics. All these topics directly affect the overall quality of the product and the resulting documentation at the end of the project.
- Employee & Team Work Quality
There are several objectives to think of when looking at the employees and the teamwork within the project group. For the personal skills and abilities, are they useful to the tasks and activities in the project itself and is every branch of the project that is involved covered by at least one person? Next, to that, the quality of the teamwork will affect the result being one complete product or a summary of materials containing a lot of different components and parts which don't fit the whole product. For example, it is not good teamwork if later the case materials are chosen based on sustainability and the electronics chosen only based on price. It will result in a product with different attributes which are not delivering the same message.
- Material & Component Quality
The quality of the material that is being used for the product will result in the most visible part of the overall quality. It is therefore important to test and refine the materials and components used. They will be given a high precision and durability standard during those tests to minimize the risk of failure (more of that in risks).
- Time Quality
As mentioned above, time is also a significant part of the project management. Not only there, but it can also be found in the quality of the product. Less time will eventually result in working faster with less regard to details and precision. This will result later in, for example, less qualitative measurements, worse documentation or choices regarding the solution. Therefore, it is mandatory to also have good time management in mind.
Next to those 3 topics, testing and refining the product after development is a huge pro when talking about quality. Therefore, the introduction chapter, where the functional tests are displayed, is referred to. Based on that, there will be a testing phase guaranteeing the highest standard of quality at the end. Table 8 includes the summary of different parameters which can directly or indirectly affect the overall quality of the outcoming product. In order to keep the standards high, the following standards and requirements need to be fulfilled.
| Description | What? | How (much)? |
|---|---|---|
| Internal & Work Ethics | ||
| Time Efficiency | Work Capacity | 240 h |
| Time Efficiency | Minimum Sprint Efficiency | 50 % |
| Finances | Budget | max. 100 € |
| Materials | Sustainible Origin | Portugal |
| Materials | Conform EU Directives | Health, Low Voltage & Mechanics |
| Product Quality | ||
|---|---|---|
| Electronics | ||
| Electronics overall | Safety | Isolated Cables and no possible harm to user |
| Sensors | Temperature Precision | +/-0.5 °C |
| Sensors | Humidity Precision | +/- 5 % |
| Overall Components | ||
| Power | Ratio of Production to Consumption | >=0 |
| Power | Low Power Consumption | Overall: < 5 Watt |
| Power | Operating time on Battery only | min. 6 hours |
| Other Materials | ||
| Wood for the Housing | Re-used & Local | from ISEP itself |
| Wood for the Housing | Durability | 1 year (before major issues arise) |
| Transparent Front | Light transmittance | min. 80 % |
| All materials | Moisture proof Durability | 1 year |
| Solar Heat Collector | maximum Temperature | -60°C - 260°C |
| Processing when fan & servo turned on | Moisture leaving the Cabinet | True or False |
| Processing when fan & servo turned on | Heat leaving the Cabinet | True or False |
| Electronics conditions | No Moisture or heat from the cabinet near the electronics | < 40 % |
3.5 People
“With great power comes great responsibility”. That's what uncle Ben used to say to Peter Parker. In order to have the responsibilities straight, an overview has been created in the form of Table 9. It displays the temporary (the first draft without any information about making those kinds of tables) responsibility table of the team members, the supervisors, and the most important teachers.
The team uses initials to fill the table, the meanings are:
R = Responsible ; W = Worker ; A = Approval ; C = Consultant ; I = Informant; Q = Quality tester
| Tasks | Elisa | Dániel | João | Marie | Nacho | Pascal | Supervisors | Abel Duarte | Benedita Malheiro |
|---|---|---|---|---|---|---|---|---|---|
| Task Allocation | R | R | R | R | R | R | A,I | ||
| Gantt Chart | R | ||||||||
| Principle Research | R | R | A,I | ||||||
| Competition Research | R | R | A,I | ||||||
| Features & Possibilities Research | W | R | A,I | ||||||
| System Diagram (Black Box) | R | A,I | |||||||
| Structural Drafts | R | A,I | |||||||
| Design | R | A,I | C | ||||||
| List of Materials | R | R | A,I | C | C | ||||
| Project Management | R | A,I | |||||||
| Marketing Plan | R | R | A,I | ||||||
| Sustainability Concerns | R | A,I | |||||||
| Ethical Concerns | R | A,I | |||||||
| Interim Report | R,W | R,W | R,W | R,W | R,W | R,W | A,I | ||
| Coding the Software | R | A,I | |||||||
| Assembly of the Materials | A,I | ||||||||
| Circuit Assembly | A,I | C | |||||||
| Functional Tests | A,I | ||||||||
| Electronics Test | A,I | ||||||||
| Corrections | A,I | ||||||||
| Final Report & Presentation | A,I | ||||||||
| Poster, Paper, Video, Leaflet | A,I | ||||||||
| Review of the Wiki Contents | A,I |
3.6 Communication
In this section, the significance of communication will be discussed. In order to be on the same page during reoccurring events like weekly meetings, Table 10 will help to stay organized. Here, you will see the importance of certain activities and who is involved in that. Therefore, it is mandatory to involve and inform the right team members for each activity.
| What? | Why? | Who? | When? | To Whom? |
|---|---|---|---|---|
| Brainstorming | Development of ideas for the best solution in the End | Whole Team (divided by 3 for initial) | During the startup and specifying phase | The Team |
| Deliverables | Having continuous monitoring process during the project time | Responsible Person to the Deliverable | On the specific deadlines | To the Supervisors and responsible Teachers |
| Weekly Supervisors Meeting | “Updates and progress presentation for monitoring purposes, Q&A time” | Whole Team & Supervisors | Every Thursday | Supervisor |
| Weekly Team Meeting | More personal as above. Being communicative towards the other team members | Whole Team | Every Tuesday | The Team |
| Daily Scrum Stand Ups | Break progress into smaller chunks and review problems and blocks | Individual | Daily | The Team |
| Interim Presentation | Showing the goals, solutions, and ideas before the physical development and assembly of the proposed solution | Responsible Presentators | 11th of April | Supervisors |
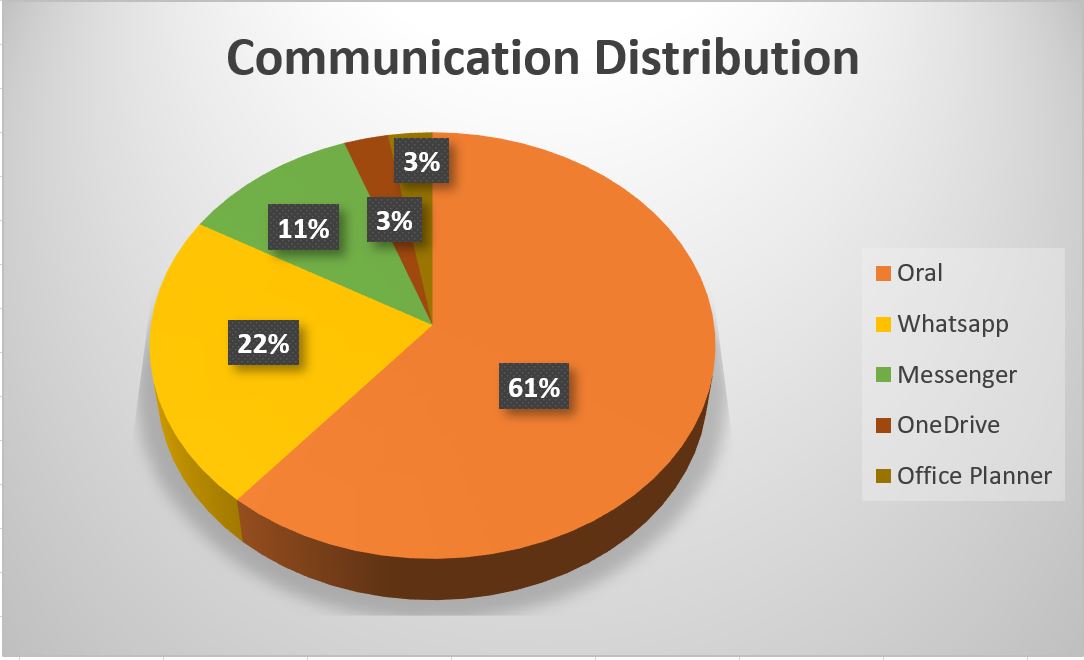
As you can see in Figure 14 below, the communication within the team is mostly consistent with oral communication. Keeping it personal is one of the biggest advantages in order to have good communication. Furthermore, the main conversations are driven through Whatsapp and Facebook Messenger. With a small percentage left, there is the OneDrive and the Office Planner included in the communication distribution. These also affect the communication positively as the team members can always fall back on these when searching for tasks that are done by the others or to revisit what to do if someone forgot their task.
3.7 Risk
Sorted by categories, Table 11 displays the first draft of the risk management table. Every risk has its cause and effect but next to that, the team needs to make sure what to do in order to avoid the risk or take the right action to certain risks. Furthermore, the team should prioritize the risks by impact and probability. This helps to make the safest and most qualitative solution of all in the end. The defined information in Table 11 clarifies the risks that are taken into account and managed.
| Risk Description | Cause | Effect | Response strategy | Impact | Probability |
|---|---|---|---|---|---|
| Internal Risks | |||||
| (Emotional) Team Disagreement | Not communicating enough and being too emotional in discussions | Arguing because of personal issues and not factual matters | [Mitigate] communicate more between team members. Talk it out (personal issues) | Medium | Medium |
| Physical and mental injuries | Sickness, broken bones, too much sport or anything else | Not being able to work and not able to reach deadlines | [Mitigate] talk about personal matters that affect progress. [Transfer] the tasks of that person to someone else | Medium | Low |
| Time Management | Not meeting deadlines, not working continuously | Not being on time and not finishing OR working too fast and lowering quality | [Avoid] being late and start working directly | High | Low |
| External Risks | |||||
| Supplier Delay | Not in stock, transportation problems | Affects time management | [Avoid] being late with the purchase | High | Medium |
| Supplier Faults | Components failure, low quality (in packaging) | Affects components failure | [Mitigate] with the supplier to claim a guarantee and replace the components quickly | Medium | Low |
| Rebuying Materials and Components | Suppliers Faults, Damage to limited materials, components failure | Higher costs and time consumption in delivery | [Mitigate] as mentioned above | High | Medium to Low |
| Misinformation | No information given, not traceable information (nothing on Moodle) | Developing the wrong requirements and unnecessary research/development | [Mitigate] take initiative to be informed about unclarities | Low | Medium |
| Canceled Classes | Illness of the teacher, etc. | See Misinformation | [Transfer] Teacher should brieve somehow else | Low | Medium |
| Technical Risks | |||||
| Components Failure | Low quality and low precision | Buying new ones, meaning time risks | [Avoid] Make sure the quality is good and be thoughtful with handling and placing it | High | Low |
| Damage to limited materials | Non-cautious use, preparation or shaping | Buying new materials, meaning time risks | [Avoid] Be thoughtful with the materials and do not overuse | Medium | High |
| Digital Data Loss (Documents and Softwares) | Computer problems | Re-writing code and recovering all documentation | [Transfer] the data to a cloud and make copies and back-up | High | Low |
3.8 Procurement
Procurement is the process of acquiring and buying products, goods or services from external suppliers. The process was used to make sure that the Team received products at the best possible price but also high quality compared with other external suppliers. However, in order to get the most sustainable product possible, the team must search for reusable materials in the workshop of ISEP and minimize the number of supplier companies. This is especially important in order to save costs and transportation pollution.
For this project, the Team was only allowed to choose suppliers from Portugal, which meant that there were more restrictions on what could be used in the final product. However, the biggest suppliers have a branch in Portugal like Mouser, LeroyMerlin, BotnRoll and electrofun.
External Suppliers are:
- botnroll.com
- electrofun.pt
- leroymerlin.pt
Furthermore, the team can depend on services that will take valuable time from the team. The only service that the team is waiting on is the appointment for accessing the workshop where the team can access tools and machines to assemble the prototype. Unlike other teams, no 3D printing is required in this topic as you can see in the list of materials and the prototype.
3.9 Stakeholders management
| Who | Role | Power | Influence |
|---|---|---|---|
| Team members | Creator | High | High |
| ISEP | Sponsor | High | Low |
| Benedita Malheiro | Main supervisor | High | Medium |
| Supervisors | Team supervisor | Medium | High |
| Teachers | Teach subject | Low | Medium |
| Suppliers | Provide materials | Low | Low |
Table 12 shows the different persons and entities which can have an influence on the project. To understand better, every entity is explained in the list below.
- Stakeholders are the persons and groups of interest in this project. They directly, and sometimes indirectly, affect the project development as well as the outcome of the development.
- In this project, there are, of course, the team members which are responsible for the whole creation of the project. Without them there would be no result nor would there be any progress.
- The infrastructure of the university where the team can develop and create the product is supplied by ISEP. This institution also grants them the ability to study there and continue their process in a specific room. It also houses libraries, laboratories, workshops, and cafeterias.
- The supervisors are a team of teachers who are dedicated to monitoring the progress of each team and give tips and adjustments to plans if needed or requested. With approvals and tips from the supervisors, the team may, and can, continue working on their project more confidently.
- Different from the Supervisors are the normal teachers. They are not part of the supervisors and are therefore not present in the meetings. However, they teach the subjects like Sustainability, Marketing, Ethics, Project Management and Communication which are all part of the specific planning and preparation of the solution. They are helping and consulting in main choices before developing the product.
- Last but not least are the suppliers. This group has a low interest in the team and only sells components and materials. When the team is making the orders according to the time management, the suppliers will have low power and low influence.
3.10 Sprint Outcomes
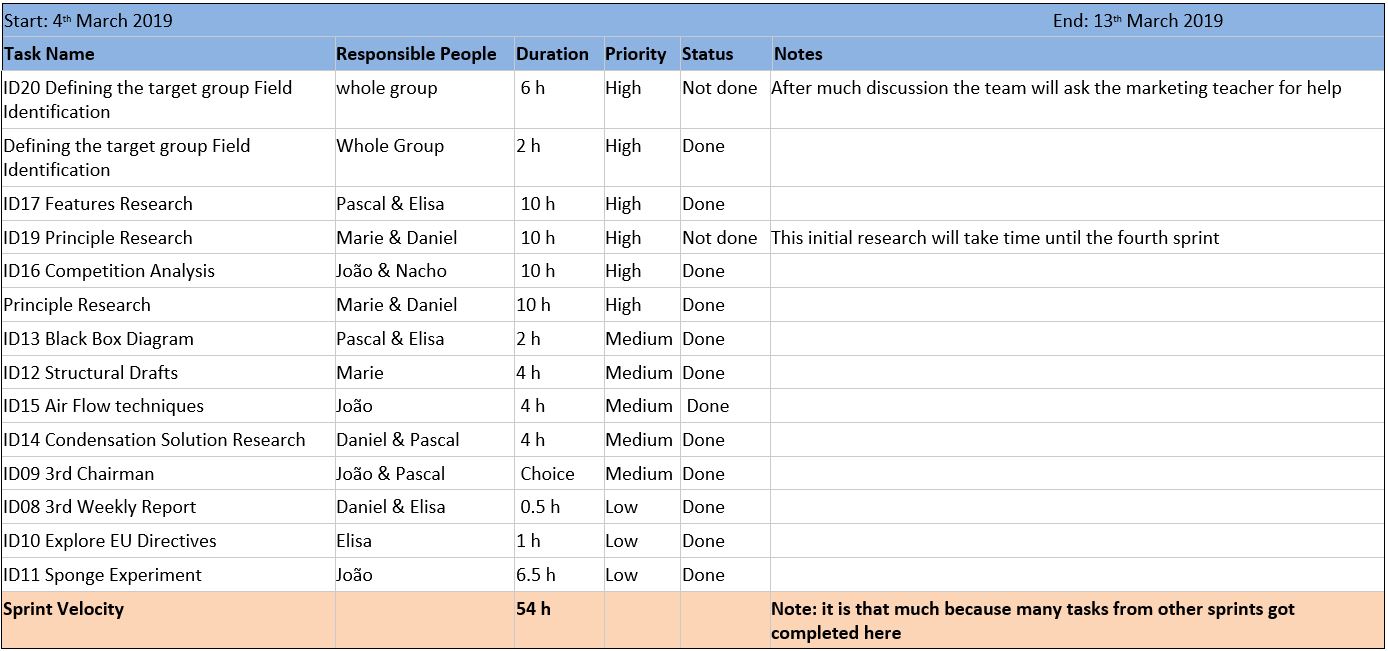
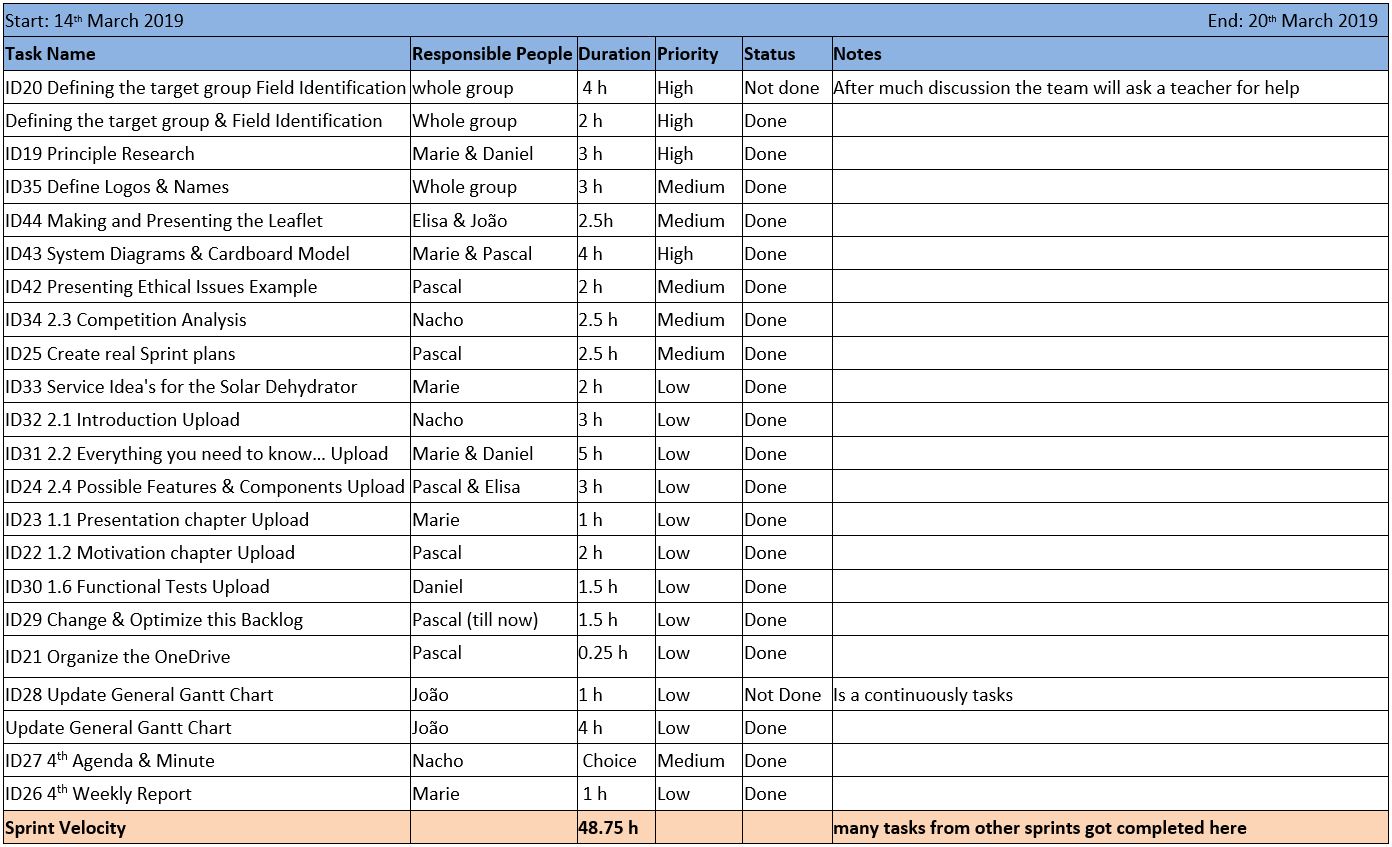
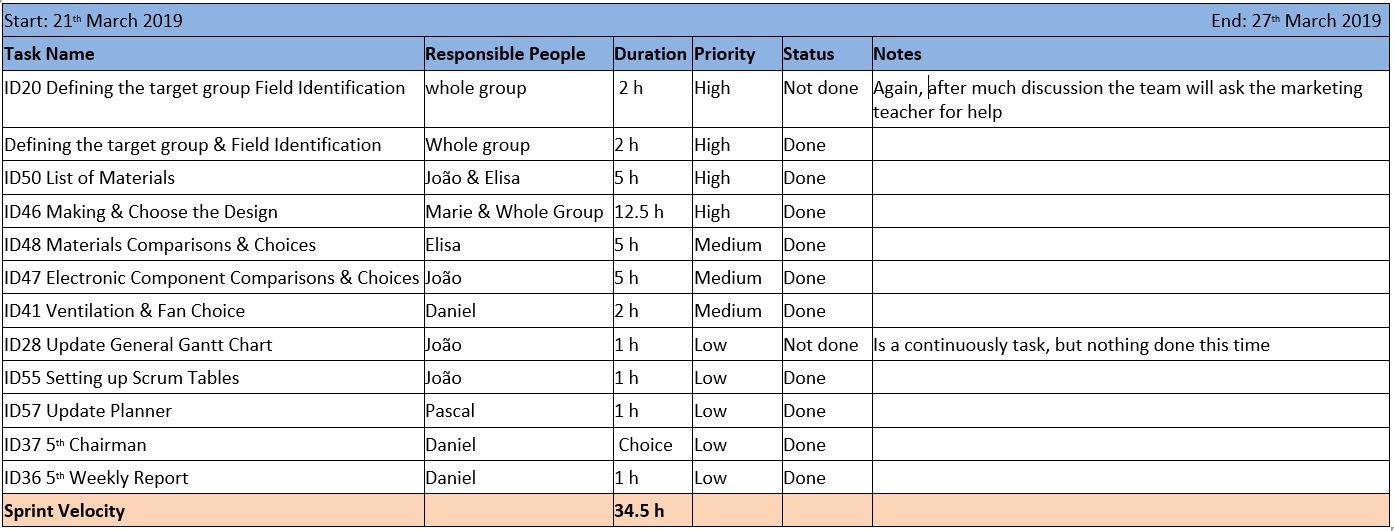
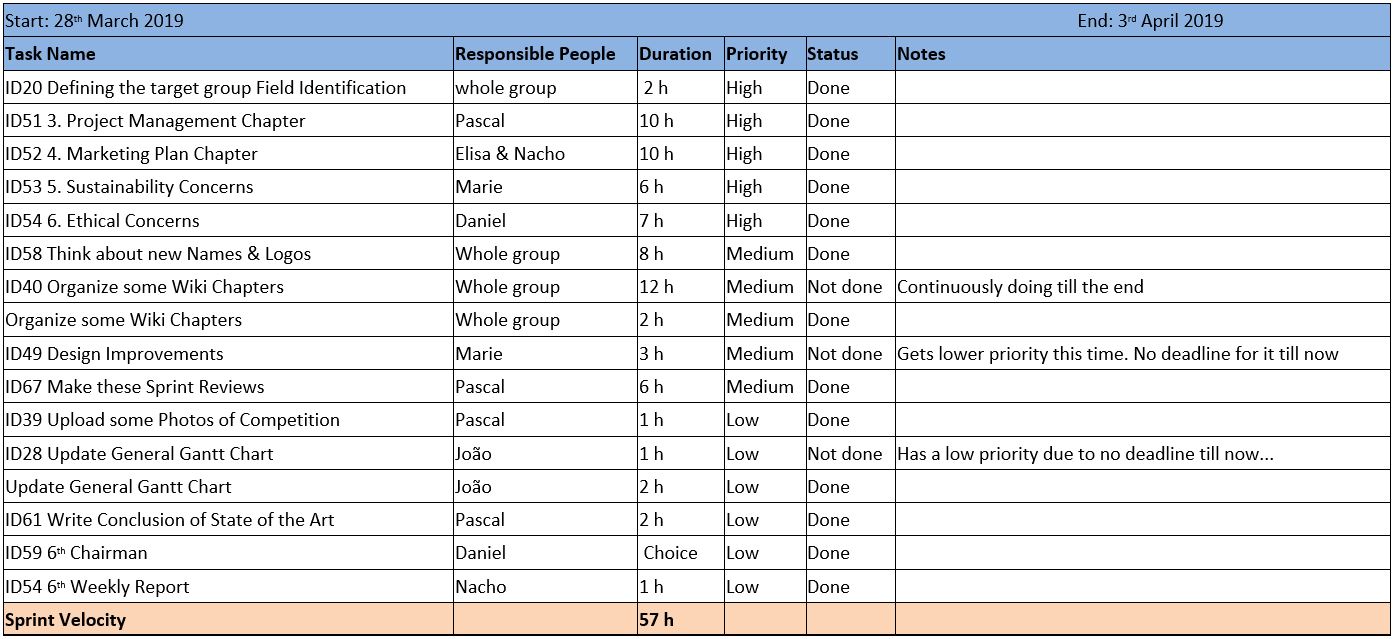
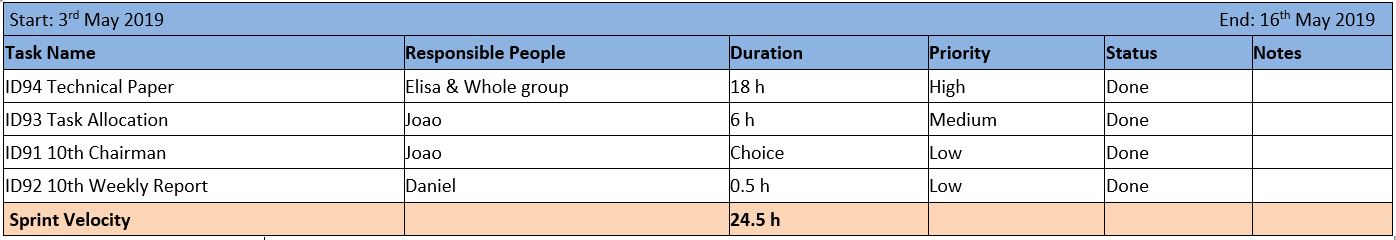
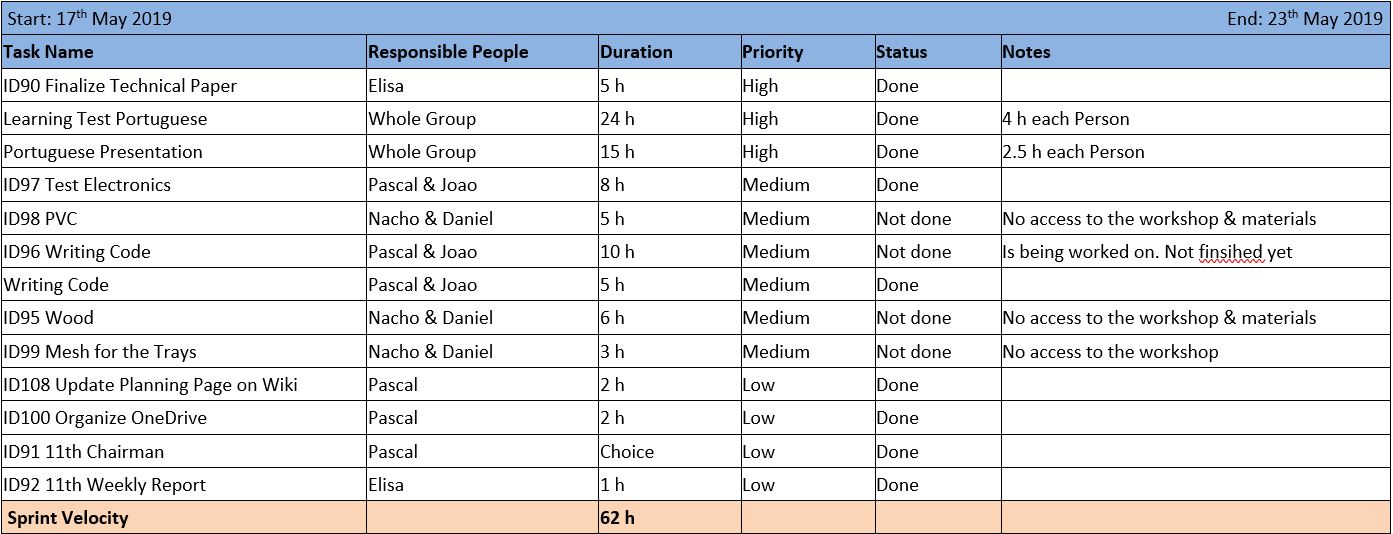
When looking back onto the Scrum approach of the project management, several tasks and tables can be reviewed and the efficiency of the working method the team is using, calculated. Table 13 illustrates how the past sprints were going, seen in hours of work. The team’s work capacity is calculated by using the number of hours per day one can work, multiplied by the number of team members and, finally, multiplied by the count of days one normally works. The team decided to do a normal work week of 5 days and 8 hours a day. Therefore, the total work capacity is 240 hours. However, because the team also needs to attend and focus on classes the actual available capacity is the work capacity subtracted by the total hours of classes that occur in that specific week. The sprint velocity is the summation of all the completed tasks in one sprint and, together with the available capacity, creates the total work efficiency of the team which is calculated as followed:
\begin{equation} Efficiency_{Percentage}=100*\frac{Velocity}{Capacity_{available}}\equiv 100* \frac{Hours_{CompletedTasks}}{(Amount_{Days} * Hours_ {Working} * Amount_{Team members})-Hours_{Classes}} \end{equation}
Based on this, the project manager calculated the efficiency for the past sprints. Table 13 below shows this per sprint in rows.
| Sprint | Work Capacity | Available Capacity | Sprint Velocity | Efficiency |
|---|---|---|---|---|
| 1 | 240 h | 78 h | 60 h | 76.9 % |
| 2 | 240 h | 84 h | 47 h | 55.9 % |
| 3 | 240 h | 57 h | 52 h | 94.7 % |
| 4 | 240 h | 117 h | 48.7 h | 41.7 % |
| 5 | 240 h | 102 h | 34.5 h | 33.8 % |
| 6 | 240 h | 105 h | 57 h | 54.2 % |
| 7 | 240 h | 147 h | 61.5 h | 41.8 % |
| 8 | 240 h | 48 h | 34 h | 70 % |
| 9 | 240 h | 132 h | 57.5 h | 43.4 % |
| 10 | 240 h | 192 h | 24.5 h | 12.7 % |
| 11 | 240 h | 198 h | 62 h | 31.3 % |
| 12 | 240 h | 186 h | 27 h | 14.5 % |
| 13 | 240 h | 198 h | 89 h | 47 % |
| 14 | 240 h | 210 h | 96.5 h | 45 % |
Table 13 shows relatively changing efficiencies throughout the sprints. This can be easily explained by counting in the knowledge of scrum: this means that the team is learning how to use the approach in the first 3 sprints and after that, the estimation of the tasks lengths and the number of tasks increased because “they can do more” with their time. Next, to that, some bigger tasks that were going on through 3 sprints were actually completed in the third sprint so all the invested are counted only in that one sprint. That is the reason why the velocity is so high in the third sprint and so low in the first two.
Further details about how the tasks were estimated and distributed among the team members are shown down in Tables 14 until 23. Over time, the sprint reviews and the calculated velocities will decrease because of some events like the ordering of the components and materials on which the team has to wait. Next to the sprint outcomes, in some weekly meetings, the team does some feedback. However, there hasn't been (new) feedback in every meeting. That is why there is sometimes missing feedback on some sprints.
Stop doing:
- Getting late to supervisors meeting
Start doing:
- De-stressing activity, try to do a Social Team Meeting (beers, pool, café) every week, trying to talk to each other in another atmosphere apart from the university/project.
- Look at agenda’s and documents that are created to give feedback and suggestions to it.
- Keep meetings short & Chairman in the middle.
Keep doing:
- Communicating so much
- Meetings are really a good way to have an overview.
- The works ethics (dividing tasks & getting to work).
Stop doing:
- 2-hour meetings (do not work while in a meeting)
Start doing:
- Just present progress, do not make progress during the meeting (show & tell)
- Marie & Elisa: speak up in a full and loud classroom
- Daniel: be open & visible with your progress (be vocal about your finishes)
Start doing:
- Daily Stand Ups in the Planner/OneNote.
- Daniel taking leadership if he is assigned to it.
Stop doing:
- Discuss a bit after the meeting, which comment of the supervisors will be kept in mind and which ones will be cared about
Start doing:
- Remind each other of the meeting on Tuesdays
Keep doing:
- Short meetings are nicer
- Daily Stand Ups fill in
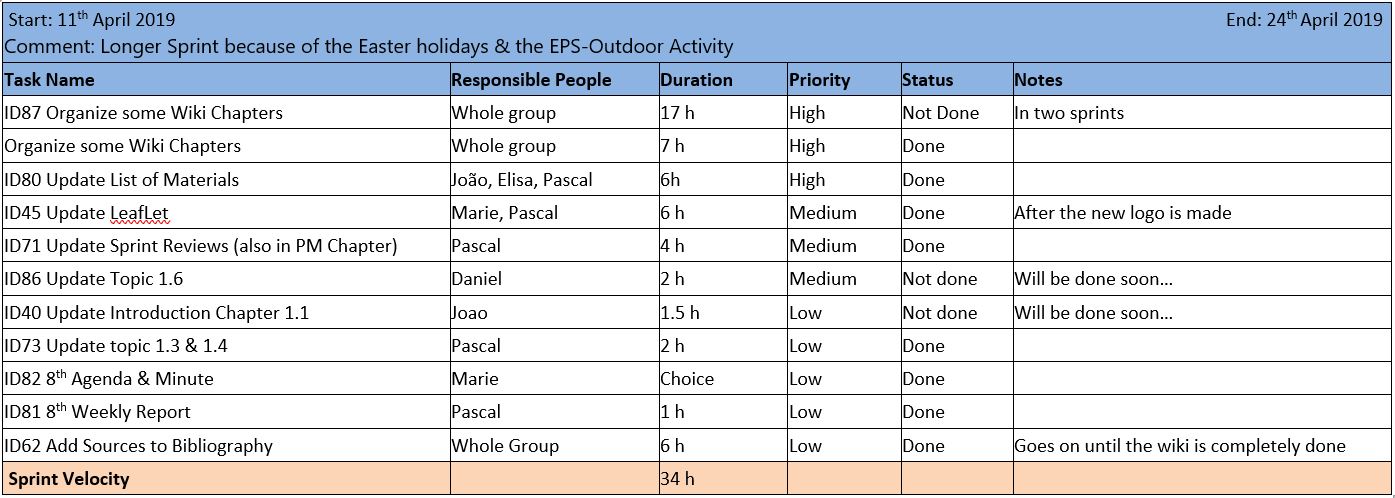
Comment: The team is still waiting on materials and on top of that the response of the supervisors for accessing the workshop to start working on the assembly. Furthermore, the amount of tasks is at a huge low and therefore the efficiency goes down. Last but not least the student week loosed up everyone so that it was harder to start working again.
Comment: The team is still waiting on the last set of materials and for a green light on accessing the workshop to start working on the assembly. Furthermore, the amount of tasks is at a huge low and therefore the efficiency goes down. There were two tasks from the Portuguese language teacher, that pumped up the productivity a little bit.
Comment: Because of long waiting times on the workshop and previous planning issues the work that could be done is lower than normal.
Comment: In this week the productivity went enormously down because two of the members were on a journey to explore the world for a week. Next to that, the schedule of the workshop limited the time the group could actually work on the prototype.
3.11 Sprint Evaluations
To summarize, the sprints keep the length of 5 workdays in a 7-day sprint as you can see in the previous chapter. Starting from Thursdays and ending on Wednesdays the week after, the sprints have the right start after the supervisors' meetings that are planned every week. In the previous chapter, in Table 13 it is possible to see how the sprints have gotten fewer classes and more free time to work on the project. However, the actual work that is being done varies from sprint to sprint. Reasons behind this are the lack of knowledge of estimating the right time for certain tasks and some more important tasks that exceeded the boundaries of three sprints and count only in one sprint (Sprint 3). However, efficiency is tending to increase with time. That either means the team is improving and/or the estimations of tasks are done better.
Next, there is a planned internal scrum meeting every Tuesday. That way, the team can review one day before the end of each sprint how tasks are going and if someone needs help finalizing a certain task. Furthermore, the team is involved in everyone's work by seeing the daily stand up notes. In there, every member writes what they worked on the day before, what they are working on that day and if they have difficulties working on it.
As seen between the sprint reviews previously, on a personal and professional level, the team is striving towards better performance and behaviour throughout the group. These will mainly be achieved by keeping open communication towards each other and being open to improvement. Based on that goal, the team is doing overall very well in case of personal management.
3.12 Conclusion
First of all, the project team itself uses the Scrum approach as a method of working and planning together in a more agile way than in a classical approach. With this current approach, the team is able to communicate more by talking about the progress and blocks every day in the daily stand-ups. By dividing the tasks into smaller sections called “sprints”, the team can focus on their deadlines on a smaller scale and stay clear-minded for the future.
The three biggest subsections of this chapter can sum up the whole chapter. The Scope Definition, Time Management, and Costs Considerations define the other 6 subsections as they are dependent on each other. The scope is the definition of what needs to be done and what won’t be done in order to have the best solution at the end. When talking about time management, the team decided to take a very energy-costing strategy. This strategy is defined not only by everyone keeping deadlines in mind but also by working and planning ahead of deadlines. Costs are minimized and thoughtfully calculated based on the budget of 100 €. Only the material resources and costs will be calculated. The work resources will not be taken into account as mentioned above.
Based on these three defined subsections, the other subsections Quality, People, Communication, Risks, Procurement and Stakeholders Management rely on those three others. With the scope, time and costs defined the overall quality measurements and definitions are clearer. It will not be the most qualitative product of all because the time is only a semester and the scope is quite full with extra deeds to be done that are coming from other branches. Having only 100 € as a budget cuts the quality down as well. As many people know, the more financial opportunities one has, the better one can think of more specific and qualitative precise components and materials.
So finally looking back, the project management is done in a new agile way of working. It is possible to take one of the six chapters and argue the management style based on the first three subsections of the project management.
In the next chapter, the approach to the Marketing Plan for this project will be discussed.
4. Marketing Plan
4.1 Introduction
This part of the report focuses on the importance of marketing as an essential part of the business world.
As a brief definition, Marketing is the discipline responsible for studying the behavior of markets and the needs of consumers. It means analyzing the commercial management of companies in order to attract, capture, and retain the final customers through the satisfaction of their desires and the resolution of their problems.
Throughout this chapter, the team will show its marketing plan, starting with the realization of the market analysis, SWOT (Strengths, Weaknesses, Opportunities, and Threats) analysis and defining the strategic objectives, segmentation, positioning, and strategy. Finally, information about the budget and the control strategy will be given.
4.2 Market Analysis
The market analysis is used to analyze the environment of the company and to find out about the strengths, weaknesses, opportunities, and threats (see SWOT Analysis) to create/reinforce the strategy used. The market analysis is composed of three smaller analyses:
- Analysis of the macro-environment
- Analysis of the meso-environment
- Analysis of the micro-environment
These three analyses can be summed up in Figure 15 :

In this project, the team will only do the macro-environment analysis and the micro-environment analysis.
4.2.1 Macro-Environment Analysis
To do the analysis of the macro-environment, the team used the PESTEL Analysis (Political, Economical, Social, Technological, Environmental and Legal), a tool to understand market growth, to evaluate the opportunities and threats of the external environment of the company. Table 27 shows the different factors of the macro-environment that make an impact on the company. These factors can be divided into Opportunities and Threats and sorted into the six criteria of the PESTEL Analysis.
| List of factors | Opportunity | Threat |
|---|---|---|
| Use of renewable technology (solar) and low power consumption, low-cost drying, can emotionally touch people who are active for the environment | Environmental, Economical, Social | |
| Competition: clients buying already dried fruits would make the dehydrator useless (ex: Fruut) but also simply buying a dehydrator from another company | Economical | |
| Use of solar energy which means no problems in terms of politics or laws (ex: no taxes on polluting and non-renewable energies) | Political, Legal | |
| Technology “less” advanced that might not interest people who simply want efficiency (ex: electrical dehydrators). | Technological |
The opportunities are in the environmental, economic, social, political and legal fields. The use of renewable technology and low power consumption is an opportunity as it doesn’t use any fossil energy. This makes the drying low cost. As it is eco-friendly with the use of the Sun as a power source, it can emotionally touch people who care and are active for the environment. These three opportunities can be sorted in the environmental, economic and social fields. The use of solar energy means that the product won’t be troubled by any environmental laws or politics: there won’t be any taxes on polluting or non-renewable energies either. This makes opportunities in the political and legal fields. Despite all these opportunities, there are also threats to the project. The renewable energy market is a growing one which also means there is a growing competition, and this competition can be quite important. Companies selling dried fruits or other dehydrators companies, whether they sell electrical or solar dehydrators can be considered to be threats. Electrical dehydrators are a threat because even if the team is part of the solar dehydrators market, it is also part of the broader dehydrators market. Because of that, it is an economic threat. Finally, linked to the previous point, as the drying technology is “less” advanced than for electrical dehydrators, the product might not interest people who just want efficiency. It is a technological threat.
4.2.2 Micro-Environment Analysis
For the analysis of the micro-environment, Porter’s five forces analysis was used. It is a tool to analyze the competition of a market. Figure 16 represents the five forces of Porter.
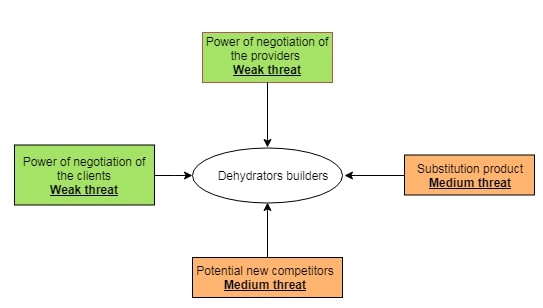
- Power of negotiation of the providers (Weak):
The components used to make the solar dehydrators are all, or almost all, quite simple and cheap. It is made mostly of wood, transparent PVC, and a few electronic parts. Because of that, no provider is essential or anything like that, so their power is low.
- Power of negotiation of the clients (Weak):
The clients of this type of product aren’t especially demanding as the product is quite simple and easy to use and there might even not be a need for after-sales services. The only feature needed is that the product dries food.
- Substitution product (Medium):
As the product is using solar energy, it might not be as efficient as dehydrators using other energy sources like electricity. Because of that, the clients targeted should be those interested in saving money and those emotionally touched by the fact that it is an environment-friendly product. Despite that, it still means a loss of potential clients.
- Potential new competitors (Medium):
Solar, and more broadly, renewable energy's industry is becoming quite an important field because of nowadays environmental concerns. That means that more and more companies are interested in that field because it can bring profit, and more companies interested means more competition.
- Rivalry in the dehydrators market (High):
The rivalry in the dehydrators market is quite high. There are a lot of competitors such as Excalibur, Sedona, Stöckli Dörrex for the electrical dehydrators but also Clipsol, Zefiro, Kascade for the solar ones. The rivalry is one of the most threatening aspects of this market.
4.3 SWOT Analysis
The SWOT Analysis is the analysis of the Strengths, Weaknesses, Opportunities, and Threats of the company/product based on an internal and an external diagnostics. The internal diagnostic helps in analyzing the strengths and weaknesses of the company/product itself while the external diagnostic helps in analyzing the opportunities and threats of the outside environment. The SWOT Analysis is done from the macro-environment (see 4.2.1) and the micro-environment (see 4.2.2) analyses. With these two analyses, the following SWOT Matrix was created (Table 28):
| STRENGTHS | WEAKNESSES | |
|---|---|---|
| INTERNAL DIAGNOSTIC | Focusing on renewable energy (solar). Can influence two markets: the more “closed” market of solar dehydrators and the broader one of the dehydrators in general. Use of quite advanced technology for sensors and mechanisms that other solar dehydrators don’t usually have. | Despite influencing two markets, the product is at a disadvantage for the dehydrators in general |
| OPPORTUNITIES | THREATS | |
| EXTERNAL DIAGNOSTIC | Growing demand for products using renewable energy and having low power consumption. Ecological, making it emotionally touching for people. Unaffected by laws and politics that punish polluting and non-renewable energy | Quite a strong and growing competition. “Better” technology exists for drying in terms of efficiency |
This table shows that the strengths are mainly the use of renewable energy, the use of sensors and the fact that the product can influence two markets. The weakness linked to that is that even if the product influence two markets it is clearly at a disadvantage against electrical dehydrators for people who only want efficiency. The opportunities and threats are as seen above in the Macro-Environment Analysis.
4.4 Strategic Objectives
When designing a good marketing plan, in order to achieve the planned objectives, it is advisable to follow any of the existing methods, in order to set strategic objectives; One of those methods is the SMART method. SMART is an acronym for Specific, Measurable, Realizable, Realistic and Timely.
When the team speaks of SMART, it refers to the following types of objectives:
• Specific:
- Define the goal as much as possible with no unclear language.
- WHO is involved, WHAT the team wants to accomplish, WHERE will it be done, WHY is the team doing this (reasons, purpose), which CONSTRAINTS and/or requirements does the team have?
In the definition of objectives, it is essential to detail and specify, as much as possible, so that it may be useful to consider sub-objectives that specify and reinforce the main objective.
• Measurable:
- Can the team track the progress and measure the outcome?
- How much, how many, how will the team know when its goals are accomplished?
This characteristic is one of the most relevant factors in the processes of continuous improvement and quality. The objective must conform to feasible measurement criteria.
• Attainable/Achievable:
- Is the goal reasonable enough to be accomplished? How so?
- Make sure the goal is not out of reach or below standard performance
The objectives have to adjust to the reality of the person and their environment so that they are challenging but without unrealistic expectations. If one wants to achieve their goal, one must assume their current situation, knowing the existing talent and limitations.
• Relevant:
- Is the goal worthwhile and will it meet the needs?
- Is each goal consistent with the other goals the team has established and fitted with its immediate and long term plans?
The objectives have to be raised according to the result to be achieved, establishing it in positive. If the team wants to set a goal, it is important that by putting awareness in it, suppose the desired result, not something disposable.
• Timely:
- The objective should include a time limit. Ex: The team will complete this step by month/day/year
- It will establish a sense of urgency and prompt people to do better time management.
Finally, as indicated above, this goal must have a moment of realization, in a future and desirable scenario. Figure 17 represents the SMART goals.

Getting SMART objectives, from both one and their team, ensures that the employees are committed to the results of the organization and their own professional development. Its approach has to be careful and allocating the appropriate time and attention is the way to get it.
According to the project, the team's main objectives will be:
- Creating the final prototype before 30 of June.
- Creating a website for the brand and advertising and promoting through social media.
- Starting the production with 15 Solar Dehydrator units.
- Selling 15 units during the first two years.
- After the first year, the team will sell under demand. Just in Time production.
- Expanding Dryfoo sells in the rest of European countries.
- Developing and producing a solar panel in order to decrease costs and increase the team income and to create a new range of business.
4.5 Segmentation
Market segmentation is the process of dividing a market of potential customers into segments, or groups, based on different characteristics. The segments created are composed of consumers who will respond similarly to marketing strategies and who share traits such as similar interests, needs, or locations. In dividing or segmenting markets, researchers typically look for common characteristics such as shared needs, common interests, similar lifestyles or even similar demographic profiles. The overall aim of segmentation is to identify those segments that are likely to be the most profitable or that have growth potential.
Many different ways to segment a market have been identified. Business-to-business (B2B) sellers might segment the market into different types of businesses or countries. While business-to-consumer (B2C) sellers might segment the market into demographic segments, lifestyle segments, behavioural segments or any other meaningful segment. Figure 18 shows the segmentation 41).

4.5.1 Geographic segmentation
Geographic segmentation creates different target customer groups based on geographical boundaries. Because potential customers have needs, preferences, and interests that differ according to their geographies, understanding the climates and geographic regions of customer groups can help determine where to sell and advertise, as well as where to expand the business.
In the geographic plane, the product will be focused mainly on the countries with the greatest number of annual solar hours, because the main source of energy is solar. Figure 19 refers to the European map divided by colors in relation to the solar hours in each region/area. The sale of the product will mainly be focused on countries with the greatest number of solar hours per year, such as Portugal, Spain, France, Italy, Malta, Turkey, and Greece.
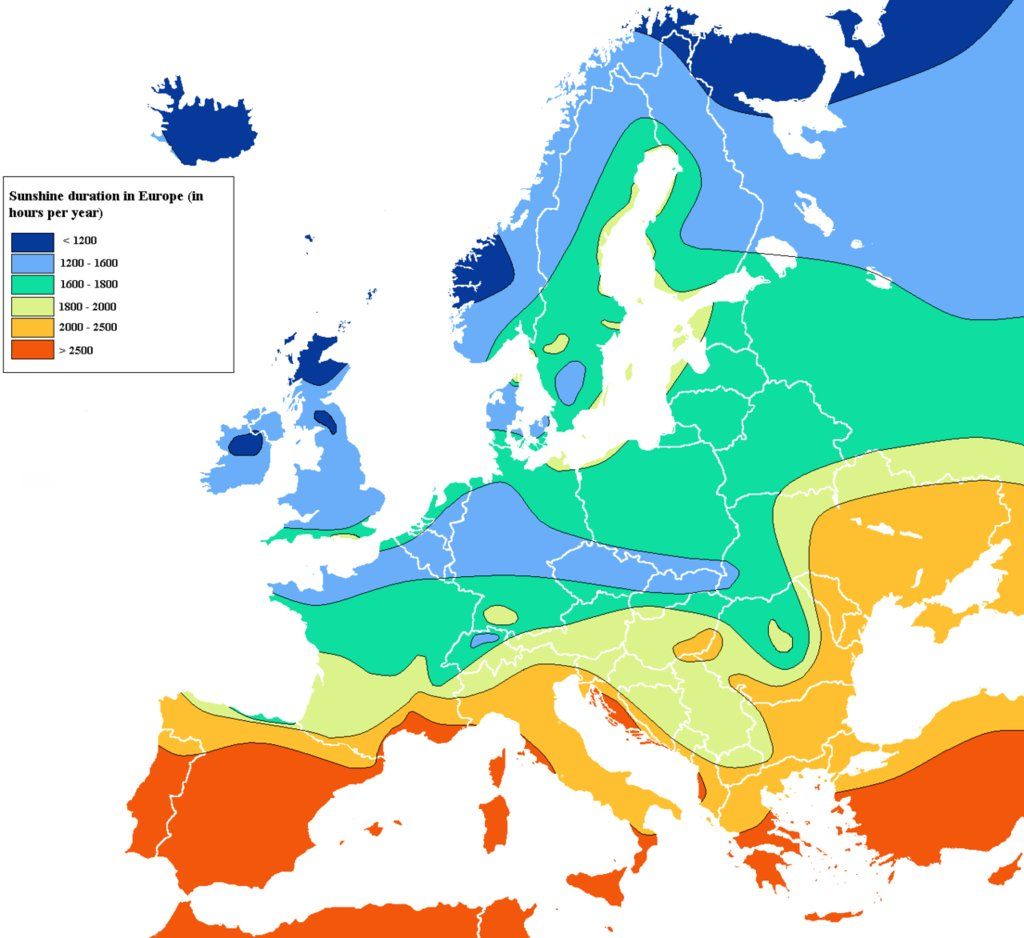
Since the project is being carried out in Porto, Portugal, the beginning of sales will focus on the two main cities of Portugal: Lisbon, the capital, and Porto. Over time, the sales results in these two cities will be analyzed periodically and, this way, the decision will be made to go one step further: to expand sales to the rest of European countries with the highest number of solar hours per year.
4.5.2 Demographic segmentation
Demographic segmentation sorts a market by demographic elements such as age, education, income, family size, gender, occupation, nationality, and more. Demographic segmentation is one of the simplest and most commonly used forms of segmentation because the products and services the people buy, how the people use those products, and how much the people are willing to spend on them is most often based on demographic factors.
The main objective, as said before, as the destination of sale of the product is Portugal, would be to expand to the rest of Europe. For the demographic segmentation to make sense, it is necessary to study both the level of wealth at European level and population density per country. Given that the product has specific characteristics (manufacturing, components, and design, among others) the team will have to take into account the two factors to be studied: level of wealth and population density.
As Portugal is the country in which the team is developing the project, it will be the country in which the product is launched to the market. Due to the population density of Portugal, Lisbon and Porto are the main target cities for the sale of the solar dehydrator. Figure 20 shows the population density depending on the area of Portugal. Logically, Lisbon, the capital, is the city with the highest population density followed by Porto, the second city in the country, in terms of size, located in the northern part of the country.
The level of wealth is another factor to take into account when taking the next step once the sale of the product is “consolidated” in Portugal. The solar dehydrator is a product that reunites high-quality characteristics: electronics, systems, design, and production. Therefore, the product will be focused on people with a medium-high level of acquisition. Although the main objective of the sale outside Portugal is the countries with more hours of sunshine per year, the level of wealth in the European countries is a very important data for future positioning of the product. Figure 21 shows the level of wealth at European level:
4.5.3 Behavioral segmentation
Behavioral segmentation divides markets by behaviors and decision-making patterns such as purchase, consumption, lifestyle, and usage. For instance, younger buyers may tend to purchase the body wash, while older consumer groups may lean towards soap bars. Segmenting markets based on purchase behaviors enables marketers to develop a more targeted approach.
The team sells the solar dehydrator to people who like to be more sustainable and healthy without giving up some comfort. People would like to know more about where the food comes from and try to eat more seasonal, local and fresh food. Next, to this, people should love to be more independent of the food market but without spending that much time on it, because people have a busy life. This idea should result in a small scaled solar dehydrator to use at home. So the team has to keep in mind that the target group should feel attracted to the product.
Additionally, the team has the idea to expand the scale of the product so the team can sell it to urban farms. In this case, the individual consumer would buy already dried food while the urban farmers would maintain the solar dehydrator. The difference with an urban farm is that one can harvest their own food, people are responsible for the growing process. The difference with a community garden is that the company gives people access to a piece of land so people don't have to think about the facilities 46).
4.5.4 Psychographic segmentation
Psychographic segmentation takes into account the psychological aspects of consumer behavior by dividing markets according to lifestyle, personality traits, values, opinions, and interests of consumers. Large markets like the fitness market use psychographic segmentation when they sort their customers into categories of people who care about living healthily and exercise.
On the one hand, regarding psychological segmentation, the product promotes sustainability and the use of renewable energies, such as solar energy. It is a product committed to the environment, being eco-friendly and the main targets are the people positioned on the side of the environment, the fight against climate change, people who want a “greener” world, women and men with an eco-friendly mentality.
On the other hand, the product is also aimed at people who care about their health and physical condition, since the objective of Dryfoo is to eat food in a different way, as a snack, while maintaining the original flavor of the product. Furthermore, the product helps to prolong the life of the food, since extracting the water and moisture from it prevents the bacteria from reproducing, therefore, helping to preserve the fruit in good condition 47).
4.6 Strategy/Positioning
For the strategy and positioning, the team analyzed what the state of the competition was by making a competition mapping (Figure 22). It was based on some criteria that have been judged to be the most important: price, size, efficiency and economical or not.
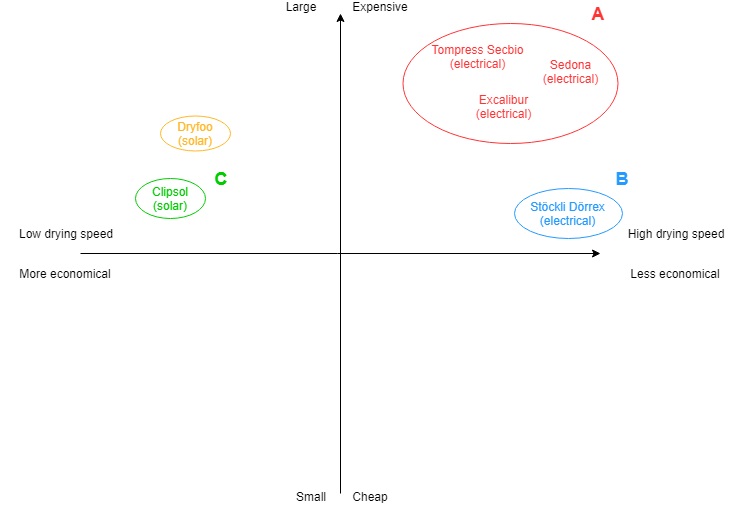
This mapping has been realized using data of 5 different types of dehydrators. The efficiency has been evaluated comparing the drying time of a pineapple slice of around 5 mm for each dehydrator. The prices and drying times for those dehydrators are as follow:
- Tompress Secbio: 390 € and 24 h
- Excalibur: 340 € and 16 h
- Sedona: 380 € and 10 h
- Stöckli Dörrex: 240 € and 10 h
- Clispol: 250 € (no information on the drying time but it is naturally higher because this dehydrator uses solar energy)
Three different types of dehydrators divided into three groups can be observed. Group A is composed of the electrical dehydrators that are very efficient but also quite expensive. Group B is constituted of the electrical dehydrators that are less expensive but smaller and also very efficient, group C is composed of solar dehydrators that are less efficient than electrical dehydrators but more economical. This map shows two points about the market. First, most dehydrators are electrical, and second, non-electrical dehydrators are generally quite expensive, and whenever they are cheaper than Dryfoo, they are often sold in kits and look very handmade with no technology at all inside. The team’s product compared to the solar dehydrator of group C is more expensive because of the use of technology that the other dehydrator lacks. It also dries food faster thanks to the addition of the fan.
4.7 Adapted Marketing-Mix
The marketing-mix is based on the method of the 4 P’s (Product, Price, Promotion and Place) as represented in Figure 23:

In this subchapter, each “P” is analyzed concerning the team's product proposal:
- Product: The product will allow the user to dehydrate all kind of food in an ecologic way while being automatic, and will also possess an interface with which the user can interact. This way, the user can see the current temperature and humidity and adjust them if he/she wants to.
- Price: The exact price of the product is not known yet, but the budget for the prototype is 100 €. The team needs to consider all production costs for the final product, thus the final price of the product may be around 300 €.
- Place: The product can be bought on the company’s website. It will be available in Portugal first but selling in Spain is also considered for the near future.
- Promotion: The team will mainly use, for now, social media, like Facebook or Instagram and the website.
Table 29 presents the competition matrix that was realized after having analyzed the market.
| Dryfoo | Tompress Secbio | Excalibur | Clipsol | Sedona | Stöckli Dörrex | |
|---|---|---|---|---|---|---|
| Type | Solar | Electrical | Electrical | Solar | Electrical | Electrical |
| Size | Medium | Large | Medium | Medium | Large | Small |
| Drying Speed | Slow | Medium-Fast | Fast | Slow | Medium-Fast | Fast |
| Sustainable | Yes | No | No | Yes | No | No |
| Price | 300 € | 390 € | 340 € | 250 € | 380 € | 240 € |
4.8 Budget
Advertisement is an important part of marketing because it raises the awareness of people towards the product. As such, the team must think about the budget it is willing to use in such promotion. Table 30 sums up the marketing budget.
| Expense | Budget (€) |
|---|---|
| Leaflet | 600 |
| Poster | 200 |
| Online Advertising | 2000 |
| Professional Website | 1000 |
| Social Media | 1200 |
| Total | 5000 |
4.9 Strategy Control
The control and evaluation of the strategy consist of measuring the impact that the planned actions have had. This process helps the company to know and analyze if the proposed planning is really directing the organization in the right direction.
This contemplates two important phases: supervision and then the study of the results. Controlling a strategy involves verifying that the planned actions are being carried out and that the plan is followed. This way, the results can be measured in the light of relevant data. It is logical to think that, if the team does not carry out the steps ordered in a methodical way indicated by the strategic planning, the team will not be able to know later if the design works or not.
For its part, the evaluation of the strategy gives a clear picture of what happens with the company. It tells what is happening with the organization and where it is going. Also, it allows to carry out corrective actions, if necessary. It could be said that the control phase is more oriented towards immediate action thanks to supervision; while the evaluation serves to gather information, and then plan actions that improve the company's future.
An effective control strategy is the PDCA cycle or the Deming cycle, seen in Figure 24, which is a continuous quality improvement strategy in four steps: Plan, Do, Check, and Act.
- Plan: Plan ahead for changes. Analyze and predict the results.
- Do: Execute the plan, taking small steps in controlled circumstances.
- Check: Check, study the results.
- Act: Take action to standardize or improve the processes
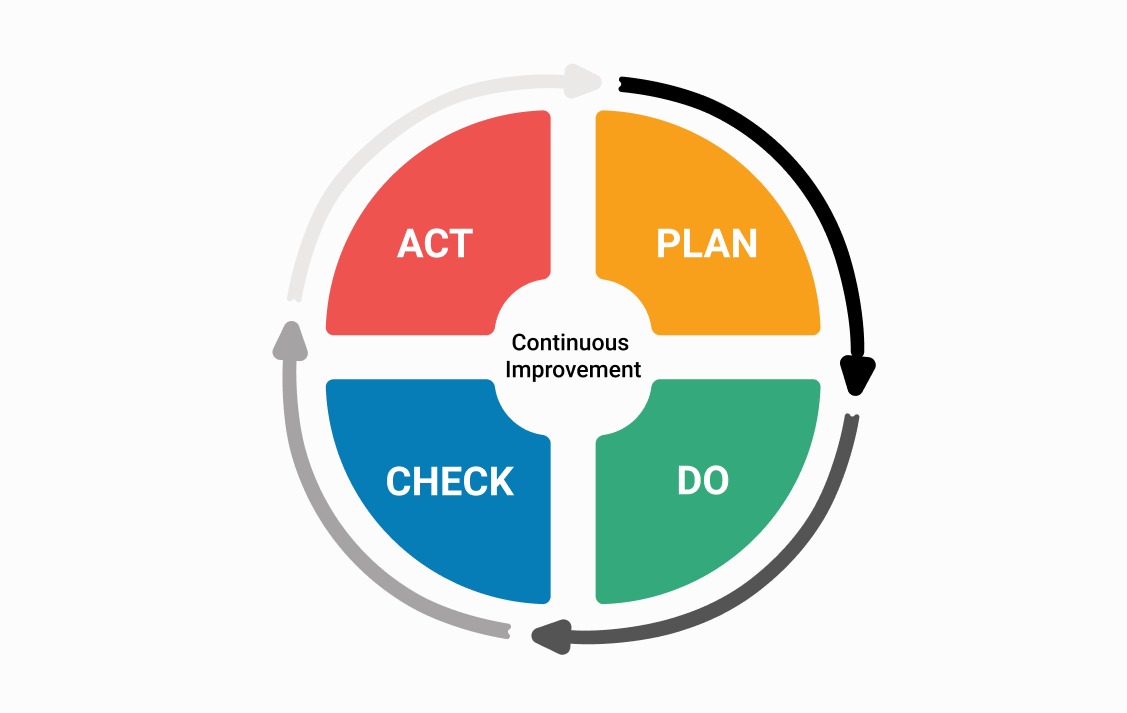
The results of the implementation of this cycle allow companies to comprehensively improve competitiveness, products and services, continuously improving quality, reducing costs, optimizing productivity, reducing prices and increasing market share. It increases the profitability of the company or organization.
The control and evaluation of the strategy is an equally important step as the planning itself. If the team considers that planning is the process that allows it to guide, then its control and evaluation tell if the team is heading to success or failure. The company having a promising future depends directly on the actions that have been planned for that purpose. Therefore, it is essential to know if the right decisions were made and if the business environment has changed in such a way that the strategy is not adjusted to reality. Similarly, it is essential to understand if the people are on the right track and if there is the possibility of taking more and new opportunities.
4.10 Conclusion
Based on the macro-environmental study, the team can identify the different factors that will have an impact on the company, dividing them into opportunities and threats. After the micro-environmental analysis, the team has to make clear the competence in the market, as well as the possible power of negotiation with customers, suppliers and the existing competition. Thanks to the two previous analyzes, the team has been able to carry out a complete SWOT analysis, which has helped to identify the strengths and weaknesses from an environmental point of view so that the team can know its opportunities and take advantage of them.
In the strategic part, the team has worked with the SMART method to define the objectives in a precise way and to enter effectively in the market. Through this analysis, the team has been able to make the segmentation of the consumers and in this way to be able to define its target group. The team's aim would be to sell 15 units of Dryfoo, at a price of about 300 € before taxes, in a 2-year period of time.
Consequently, the team has created Dryfoo, a sustainable solar dehydrator that respects the environment by using solar energy as its source and transforming it into heat which helps to dehydrate the fruit so that it can be preserved longer, without losing the nutritional properties and maintaining the original flavor of the fruit. All this is achieved by designing a product with the equipment and the necessary system to control fundamental parameters such as temperature, air flow, and air density.
The next chapter addresses the necessary measures to take into account so that the product, Dryfoo, adapts to the fundamental needs to contribute for the planet's sustainability by, for example, working to reduce energy consumption.
5. Eco-efficiency Measures for Sustainability
5.1 Introduction
Our planet is running out of resources. On planet Earth, many people live together and all of them have different needs and habits. At this moment, the way in which these needs are fulfilled is too harmful to the Earth. Sustainability helps to satisfy the needs of the present without damaging the planet and doesn’t restrict the next generation in meeting their own needs.
Preserving food is a human need that has existed for as long as humanity. There are different ways to preserve food for a long period. The most common way is freezing. This process requires constant electricity supply so it consumes a lot of energy. Another way to preserve food is by drying it, for example, with a dehydrator. In comparison with freezing, this storage technique is much more energy efficient. Only the drying process uses energy. Once the food is completely dry, it can be easily stored without any further energy consumption. Moreover, it is possible to use green energy resources to supply the dehydrator of energy. That is what the solar dehydrator does. It is an energy efficient product that uses the Sun to dehydrate the food. Additionally, the dried food is easily storable in an airtight jar. This is a positive point for energy consumption during transportation because it doesn’t require any special infrastructure like, for example, a cooled truck. Furthermore, dried food is more compact than fresh food so the amount of food that fits in one truck is higher than with fresh or frozen food.
Nevertheless, sustainability is more than just reducing energy consumption. The World Summit on Social Development identified three pillars that contribute to the philosophy and science of sustainable development. Those three pillars are environmental development, economic development, and social development 50). In this chapter, those will be discussed and the team will point out how it believes the project contributes to these pillars. After this, the whole life cycle of the product will be described.
5.2 Environmental
Environmental sustainability is about protecting the environment on different aspects.
One of the aspects is the regulation to prevent pollution and to keep carbon emissions low. Dryfoo works almost completely on renewable resources. The radiation of the Sun is being used to create heat inside and to induce electricity by using a solar panel. This electricity powers the fan and the Arduino so that the conditions inside the cabinet can be automatically controlled. If the Sun is not shining, a small battery supplies the system in energy so that the drying process may continue.
Another aspect is to re-use, reduce and recycle materials and resources as much as possible. All the construction materials are recyclable. The Arduino, fan, and sensors are components that can be re-used. Consequently, all the components should be easy to remove to make recycling, re-using or repairing possible. All of this is considered during the design process.
5.3 Economical
The general definition of economic sustainability is the ability of an economy to support a defined level of economic production indefinitely. The world's nations presently define their top economic goal in terms of Gross Domestic Product (GDP). This is the total amount of products produced within a nation, usually within one year 51).
This results in an economic system where producing new products, services and technologies are one of the most important concerns. The current system is more focused on producing new things instead of wondering if it is needed or not. This mindset has a bad effect on the planet, like too much pollution and scarcity of resources. Economic development helps to encourage businesses to adhere to sustainability guidelines beyond legislative requirements. It is up to politics to define these guidelines, rules, and laws. Those guidelines and rules have to be preventive and not curative. For example, a company that has to pay for the extra CO2 emission that it has produced is a curative guideline. This is good for the economy but still harmful to the environment because the pollution isn’t reduced.
Dryfoo has a low impact on the environment. It is made out of locally produced materials from local suppliers. The selection of suppliers is a well-considered choice. Before making an agreement, the team will check if they really care about sustainability. This way, BeSol don’t burden the environment indirectly.
5.4 Social
The first aspect of social development is the awareness to protect people’s health and wellness from pollution and other harmful activities. Dryfoo contributes to this in the next two ways:
Natural materials and coatings
To be sure that the food doesn’t become polluted, natural materials and coatings are used. So that when the temperature rises inside, possible harmful fumes will be prevented.
Improve the quality of food
The solar dehydrator produces dried food which has a large amount of vitamins, fibers, minerals, and carbohydrates. The drying process also reduces the amount of fat in the food. Dehydrating improves the quality of the food and contributes to the user’s health.
Another aspect of social development is education. This includes encouraging people to participate in environmental sustainability. This can be reached by giving people what they want without compromising the quality of life. The main need for the target group of Dryfoo is to live a healthy life without much effort. To fulfill this demand, a satisfied feeling needs to be created. The solar dehydrator will give the user two different types of satisfaction. The first one is a feeling of independence when the user eats his self-made snack by only using the Sun. To optimize this feeling Dryfoo is automatically controlled. Whereby, the user should not put a lot of effort to receive a good result. The second type of satisfaction is the feeling of being healthy and good for the planet. Dried food is a healthy snack and it feels even healthier when it is completely dried on solar energy.
5.5 Life Cycle Analysis
Figure 25 is a schematic overview of the life cycle of a product. Each product goes through all these stages. The idea behind this scheme is that each stage can be accomplished by working on the result of the previous stage, so that all the materials and resources can circulate as long as possible. In the next paragraphs, each stage of the life cycle of Dryfoo is clarified.
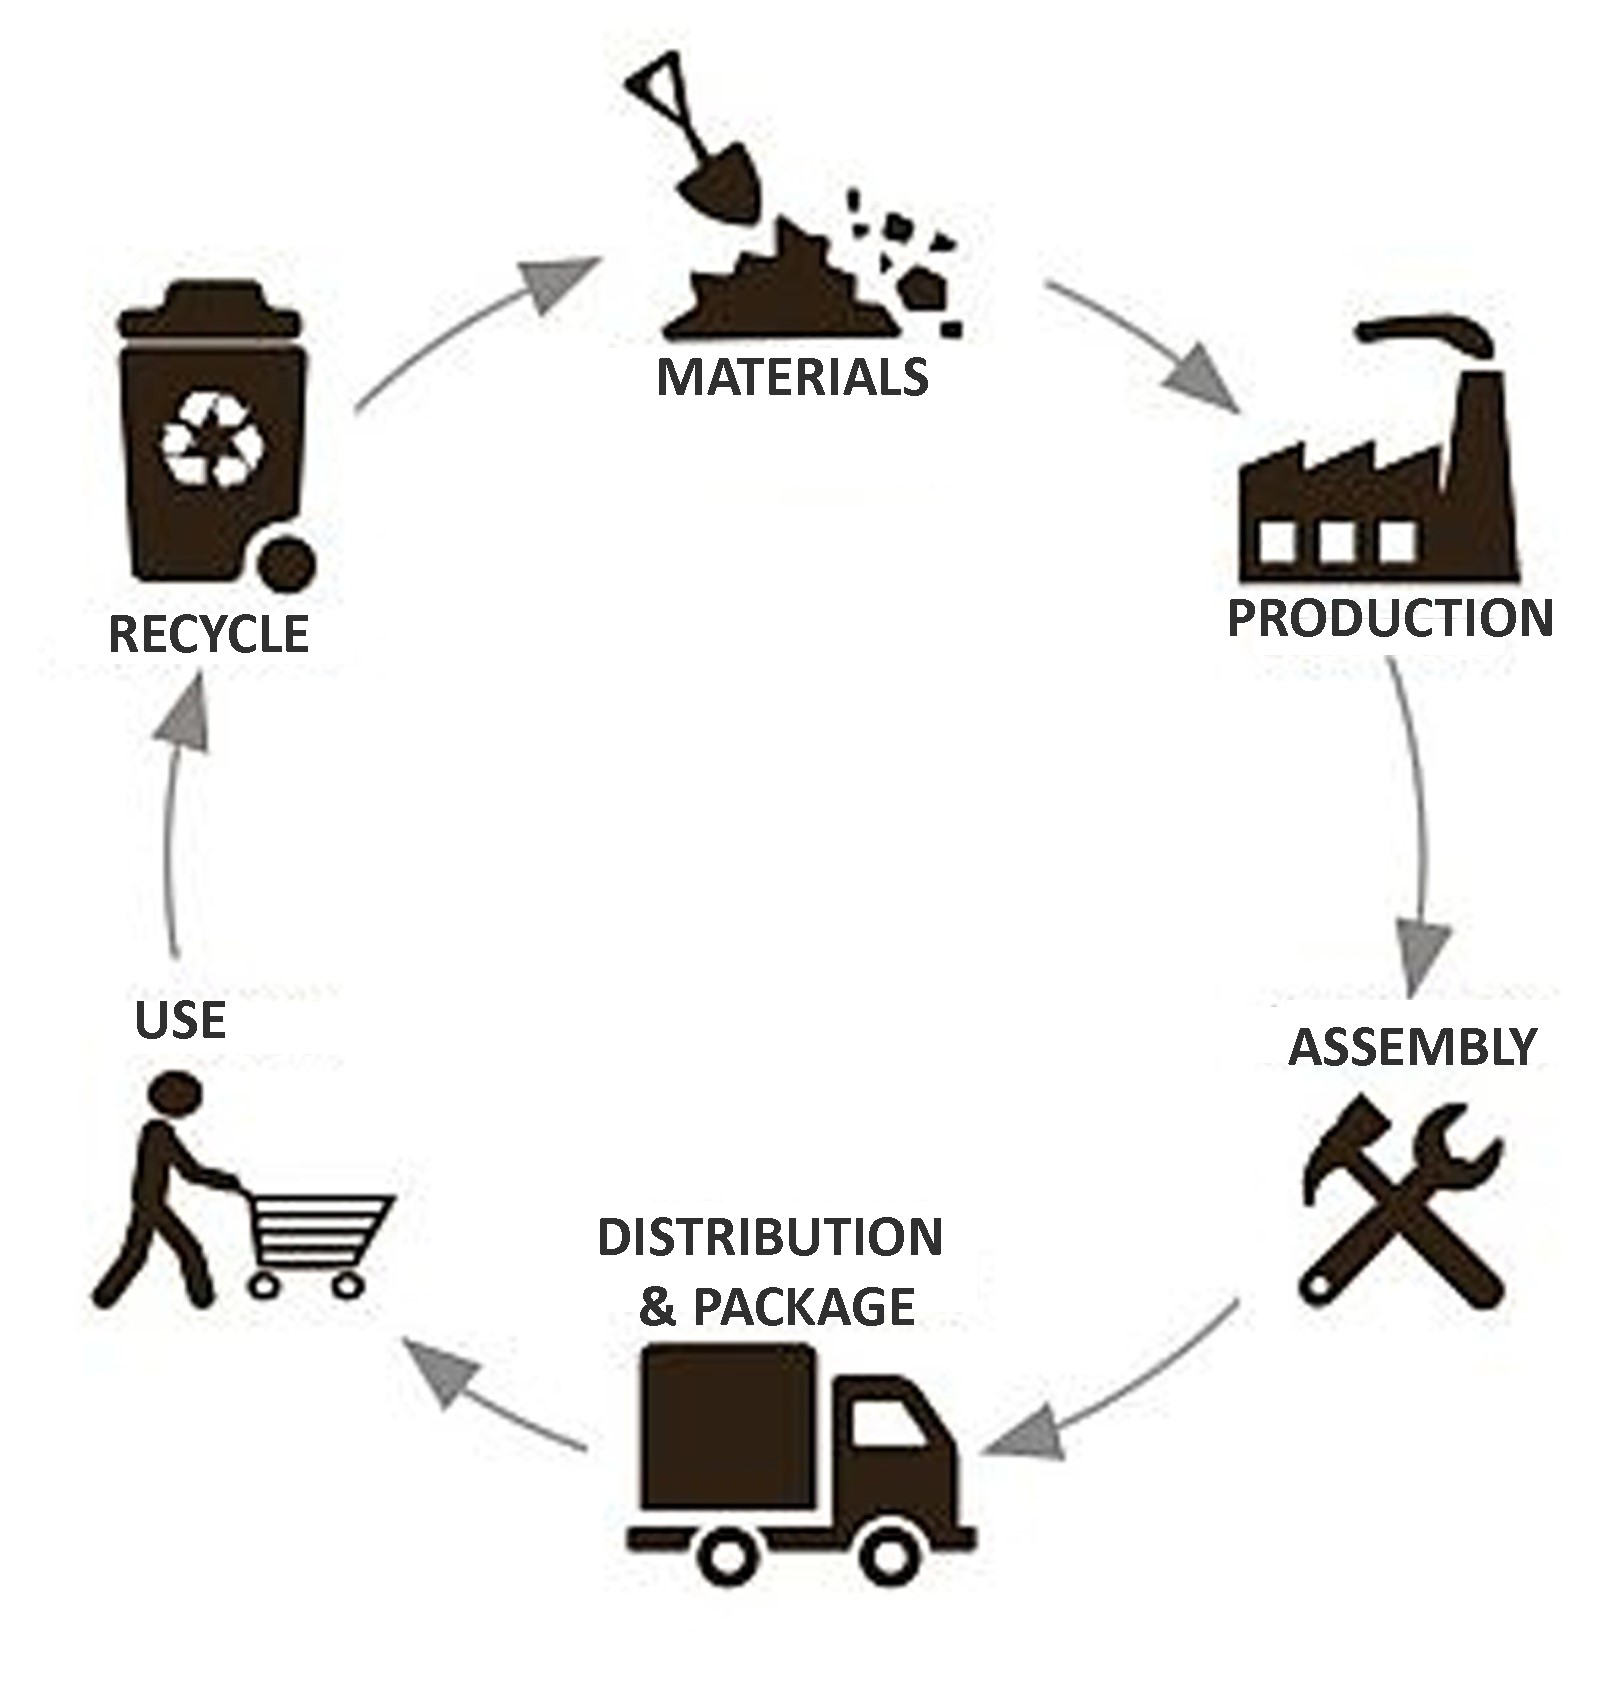
Materials
Dryfoo is, for around 90%, made out of maritime pine wood. This is a type of pine wood native to the Mediterranean region. It is a natural and recyclable material, a good insulator, easy to clean and bendable. Glued wood types (ex. plywood, MDF, soft board, etc.) are most of the time cheaper but they can only be recycled as fuel for energy generation. Consequently, massive wood fits better in the life cycle idea than plywood because it is completely recyclable and it is possible to make new products out of it. Even if maritime pine wood is protected by some paint or oil, it stays entirely recyclable. The reason for that is that the percentage of paint and oil is negligible compared to the volume of the wood. To keep the wood as natural as possible, natural oils and eco-friendly black paint is used to finish it. In the range of massive wood types, maritime pine is one of the best options because of its properties: it is quite easy to work with machinery or hand tools and it allows a good finishing. It holds mechanical fasteners well and glues easily 52). Additionally, it represents 30% of the Portuguese forest, so it is a local material and also generously present 53).
As in the final product, the prototype is made mainly out of wood. It is re-used from wood that was found in the ISEP storage room, coming from doors or tables. The solar collector is made of black rubber to ensure that it catches the heat as much as possible. Every other bent part is made of PVC, even the transparent one. PVC is easy to recycle, and using the same material several times makes it easier to recycle than using many different ones. The trays are re-used sheets covered in holes from old computer aeration parts. Everything that wasn't mentioned is the same as in the final product.
Production
Dryfoo has three bendable parts. Two of them are made out of wood. The other part is the transparent side made out of PVC. To bend these two materials, energy efficient production techniques are used. Before bending, the parts need to be cut out of a sheet. To minimize the waste of materials, the parts are optimally arranged on one sheet. This also applies to the parts that aren't bent. After cutting, the parts can be folded or further detailed.
Assembly
To reduce costs and waste, it is critical that the product can be assembled unambiguously and correctly. If there are several ways to assemble it, the chance of errors is bigger. This can result in more material waste and working hours costs. To prevent these disadvantages, groves and holes are provided in each part so that the product can be assembled quickly and in only one way. Though this results in more production steps during the production, it should decrease the costs and for sure the amount of waste. Additionally, it is also meaningful to think about design for disassembly. To attach different parts made out of the same materials, glue and screws are used, and the parts made out of different materials are only fastened by screws. This way, each material can be properly sorted for further recycling.
Distribution & package
Dryfoo will be launched first in Portugal. Later on, the company shall sell its products in Spain as well. BeSol is a small and local company which aims to keep its carbon emission low by using green resources and vehicles. Dryfoo will be packed in strong cardboard produced in Portugal. Cardboard is a perfect material to protect the product during transportation. The package is designed in such a way that it should be easy to store without using too much space. BeSol provides products that are produced entirely in Portugal and made out of local materials.
Use
Due to the fact that Dryfoo works with green resources, it has almost zero energy consumption. The only cost during use is eventually a new battery or a broken component. It is beneficial that the product can be repaired easily. All the components must be easily removable so that it can be quickly replaced without harming the product. To make this possible, all the vulnerable components are hidden in a resealable space so access is simple. Furthermore, everything must be easy to clean. This is necessary to keep the food clean and bacteria-free. The user can find more information in the manual about how to maintain the product well for a maximal lifespan.
Recycle
It is essential to keep the recycling process as accessible as possible. Otherwise, the user will lose his patience and slack the thoroughness of it. To ensure this, Dryfoo is made out of the same material as much as possible. The only parts made out of a different material are easy to separate from each other after use. This way, it is evident to sort all the materials quickly. Additionally, the manual is provided with a topic about how to recycle the product the right way. Because only a small percentage of users reads the manual, every part has a mark with the type of material.
5.6 Conclusion
Society is facing many challenges associated with a modern consumer lifestyle: the growing numbers of people on the planet, the security of food supply, clean water, and power among the greatest. It is demonstrated that several key factors need to be considered and appropriately addressed to achieve overall sustainability for human activity and development. This project implements these key factors as much as possible.
In the first place, dehydrating food is a sustainable way to preserve food. The solar dehydrator dries food by using renewable energy resources. Besides, the product itself saves the outcome energy as well. Dried food is more compact and doesn’t need special facilities during transportation, so the whole dehydrating process is energy efficient and less polluting. With Dryfoo it becomes easy to complete this dehydrating process. The conditions inside are automatically controlled so the user will get a healthy snack without too much effort. This gives the user a feeling of satisfaction and they get convinced to participate in environmental sustainability.
In the second place, Dryfoo aims to close the life cycle perfectly. Dryfoo is largely made out of maritime pine wood which is a natural and excellent recyclable material. By using the same material as much as possible, the recycling process becomes more accessible. The few parts made out of a different material are fixed to each other by screws. This way, it is effortless to separate all the different materials for further recycling. Recycling is not the only important factor, re-using is also crucial. To ensure that components like the Arduino or the fan can be re-used and repaired, they are hidden in a resealable space so access is simple. Another important ambition is to avoid material waste. All the parts are cut out of sheets. Arranging them smartly on the sheet contributes to less waste. Next, to this, there is just one way to assemble all the parts so the chance of errors is smaller. Fewer errors mean less waste and working hours costs.
Finally, BeSol intends to stay local and keeps its carbon emission low. Dryfoo will be launched first in Portugal and, later on, in Spain. The products shall be transported in a package made out of cardboard produced in Portugal. Just like the cardboard, all the other parts of Dryfoo are locally produced and provided by local suppliers.
The next chapter will introduce the ethical and deontological aspects of the project.
6. Ethical and Deontological Concerns
“It takes less time to do things right than to explain why you did it wrong.” - Henry Wadsworth Longfellow
6.1 Introduction
In this chapter, the five main ethical and deontological concerns will be presented. These are ethical issues on engineering, sales and marketing, academic concerns, environmental impacts, and liability. It is essential to pay equal attention to every principle. These ethical concerns must be respected in order to provide the highest quality to the customers, to protect the environment and to maintain a reputation and reliability.
6.2 Engineering Ethics
Figure 26 represents the aspect of ethics in engineering.
The general principles are 55):
- Engineers shall hold paramount the safety, health, and welfare of the public and shall strive to comply with the principles of sustainable development in the performance of their professional duties.
- Engineers shall perform services only in areas of their competence.
- Engineers shall issue public statements only in an objective and truthful manner.
- Engineers shall act in professional matters for each employer or client as faithful agents or trustees, and shall avoid conflicts of interest.
- Engineers shall build their professional reputation on the merit of their services and shall not compete unfairly with others.
- Engineers shall act in such a manner as to uphold and enhance the honor, integrity, and dignity of the engineering profession and shall act with zero-tolerance for bribery, fraud, and corruption.
- Engineers shall continue their professional development throughout their careers, and shall provide opportunities for the professional development of those engineers under their supervision.
- Engineers shall, in all matters related to their profession, treat all persons fairly and encourage equitable participation without regard to gender or gender identity, race, national origin, ethnicity, religion, age, sexual orientation, disability, political affiliation, or family, marital, or economic status.
6.3 Sales and Marketing Ethics

Ethical sales and marketing, or simply ethical marketing practices, isn’t really a marketing strategy. It’s more a school of thought that guides marketing efforts. Through sales ethics and ethical marketing, responsibility, fairness, and honesty are promoted. Of course, this is a difficult subject to tackle because it is highly subjective and everyone has slightly different ideas of what constitutes right and wrong. Because of that, ethical marketing isn’t so much a rule system as it is a system of guidelines. Figure 27 represents the aspect of ethics in sales and marketing.
There are eight principles of Ethical Marketing 57) :
- The common standard of truth will be observed in all forms of marketing communication.
- Personal ethics will guide the actions of marketing professionals.
- Advertising is set apart from entertainment and news and the line is clear.
- Marketers will be transparent about who is paid to endorse their products.
- Consumers will be treated fairly, depending on who the consumer is and what the product is.
- Consumer privacy will be respected and upheld at all times.
- Marketers will comply with standards and regulations set by professional organizations and the government
- Ethics should be discussed in all marketing decisions in an open and honest way.
Last but not least, based on consumer policies, BeSol will make every product that it distributes, safe and fair to the end user. He or she will be assured to use the best quality of components and materials that the products are made of. To keep this promise, BeSol pledges to give a 2-year warranty of every product that has been sold. Furthermore, free repairs within the warranty are guaranteed, and if the end user is done or has bought a newer product, BeSol will freely take back the product to either, refurbish or recycle every material as sustainably as possible. This way the consumer has the full confidence that BeSol is indeed an ethically good company.
6.4 Environmental Ethics
Environmental ethics refers to the moral relations between human beings and their natural environment. More specifically, it refers to the value that mankind places on protecting, conserving, and efficiently using resources that the Earth provides 58).
The team will try to apply the following points to the solar dehydrator:
- Maximum efficiency with a minimum energy consumption
- The materials must be environmentally friendly
- Reaching the highest possible product lifetime
6.5 Liability
For this project, the team has to take into account the following EU directives concerning liability during the development of the product:
- Machinery (MD): Concerns the danger the machine could have on humans: explosions, vibrations, radiations, getting one's finger stuck, airborne hazardous substances, force limits for machinery operation, the minimum distance to be safe, etc. 59).
- Low Voltage (LVD): Covers health and safety risk on electrical equipment with an input or output voltage of 50 V and 1000 V for alternating current and 75 V and 1500 V for direct current 60).
- Restriction of the use of certain Hazardous Substances (RoHS): Forbids the use of Lead, Mercury, Cadmium, Hexavalent chromium, Polybrominated biphenyls, Polybrominated diphenyl ether, Bis(2-ethylhexyl) phthalate, Butyl benzyl phthalate, Dibutyl phthalate, and Diisobutyl phthalate 61).
- General Food Law: Covers all stage of food and feed production and distribution, that is to say: feed production, primary production, food processing, storage, transport, and retail sale. It explains the principal requirements and procedures when making a decision in matters of food and feed safety 62).
- Food Safety: Assures control systems and evaluates compliance with EU standards in the food safety and quality, animal health, animal welfare, animal nutrition, and plant health sectors 63).
6.6 Conclusion
There are no more important or less important principles, the team has to pay attention to all of them. These ethical concerns must be respected in order to provide the highest quality to customers, to protect the environment and to maintain the team's reputation and reliability. Ethics is important to bring the maximum good or benefit to society and to the company as well. The code of ethics can improve the quality of working and can secure the public interest. An insurgency in ethics is expected to uproot the effective ethical selfishness that justifies the market as the prevalent basic leadership device in the general public. These rules will help the team to make its ideas profitable and reach its desires.
In the next chapter, the project's development will be introduced and described.
7. Project Development
7.1 Introduction
This chapter presents the development of this project, starting with the first crazy ideas and ending with a final solution followed by a prototype. The chapter is divided into six different sections.
The first section, Architecture, is about the design process. It represents the way and steps taken before the final solution was developed. The second section, Materials, shows a list of all the materials that are used for the prototype. The third section, Components, gives an overview of all the necessary components to make Dryfoo automatically controllable. The fourth section, Functionalities, explains the main functionalities of Dryfoo. The fifth section, Test and Results, shows the development of the tests performed with the prototype. The results of those tests give a better analysis of how good Dryfoo meets the requirements. The sixth and last section, Conclusion, is a sum up of the main relevant points of this whole chapter.
7.2 Architecture
In this chapter, will be presented: the black box diagram, the cardboard model, all the drawings that were made along with the SolidWorks models and, finally, the detailed schematics of the electronic components.
7.2.1 Black box diagram
The black box diagram is used to visualize all inputs and outputs of a system without paying too much attention to the internal working. Figure 28 represents the black box diagram for Dryfoo.
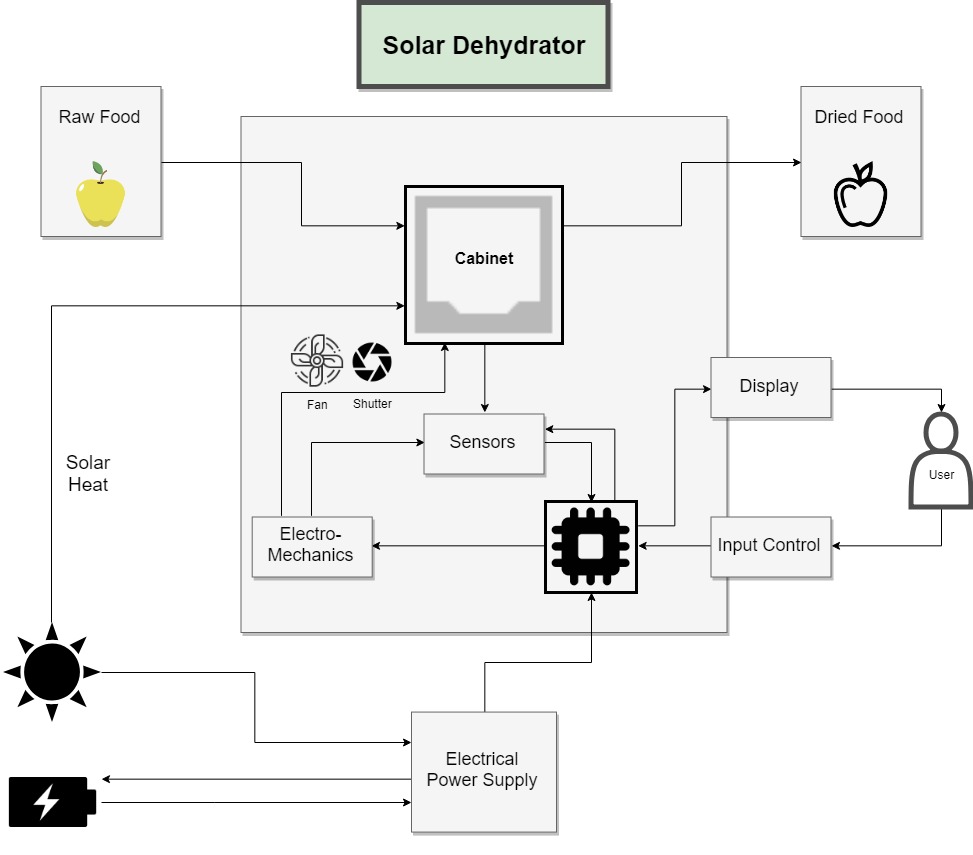
This diagram shows that there are two power supplies. One is the Sun which heats the cabinet and the other is a battery which powers the electromechanics and microprocessor. The battery is itself powered by a solar panel, making the Sun the only source of energy in the system. The most important input here is the raw food which then becomes dried food after it passes in the cabinet for a set amount of time. Finally, there is the action of the user on the product through the display. He or she can control the dehydrator from here.
7.2.2 Cardboard model
Figure 29 displays the cardboard model for Dryfoo. A cardboard model is often used in engineering to make a fast and cheap version of a product using only cardboard, glue and a mean of cutting. This physical model shows the main features of the product. This way, the usefulness and practicality of the features can be evaluated more easily.
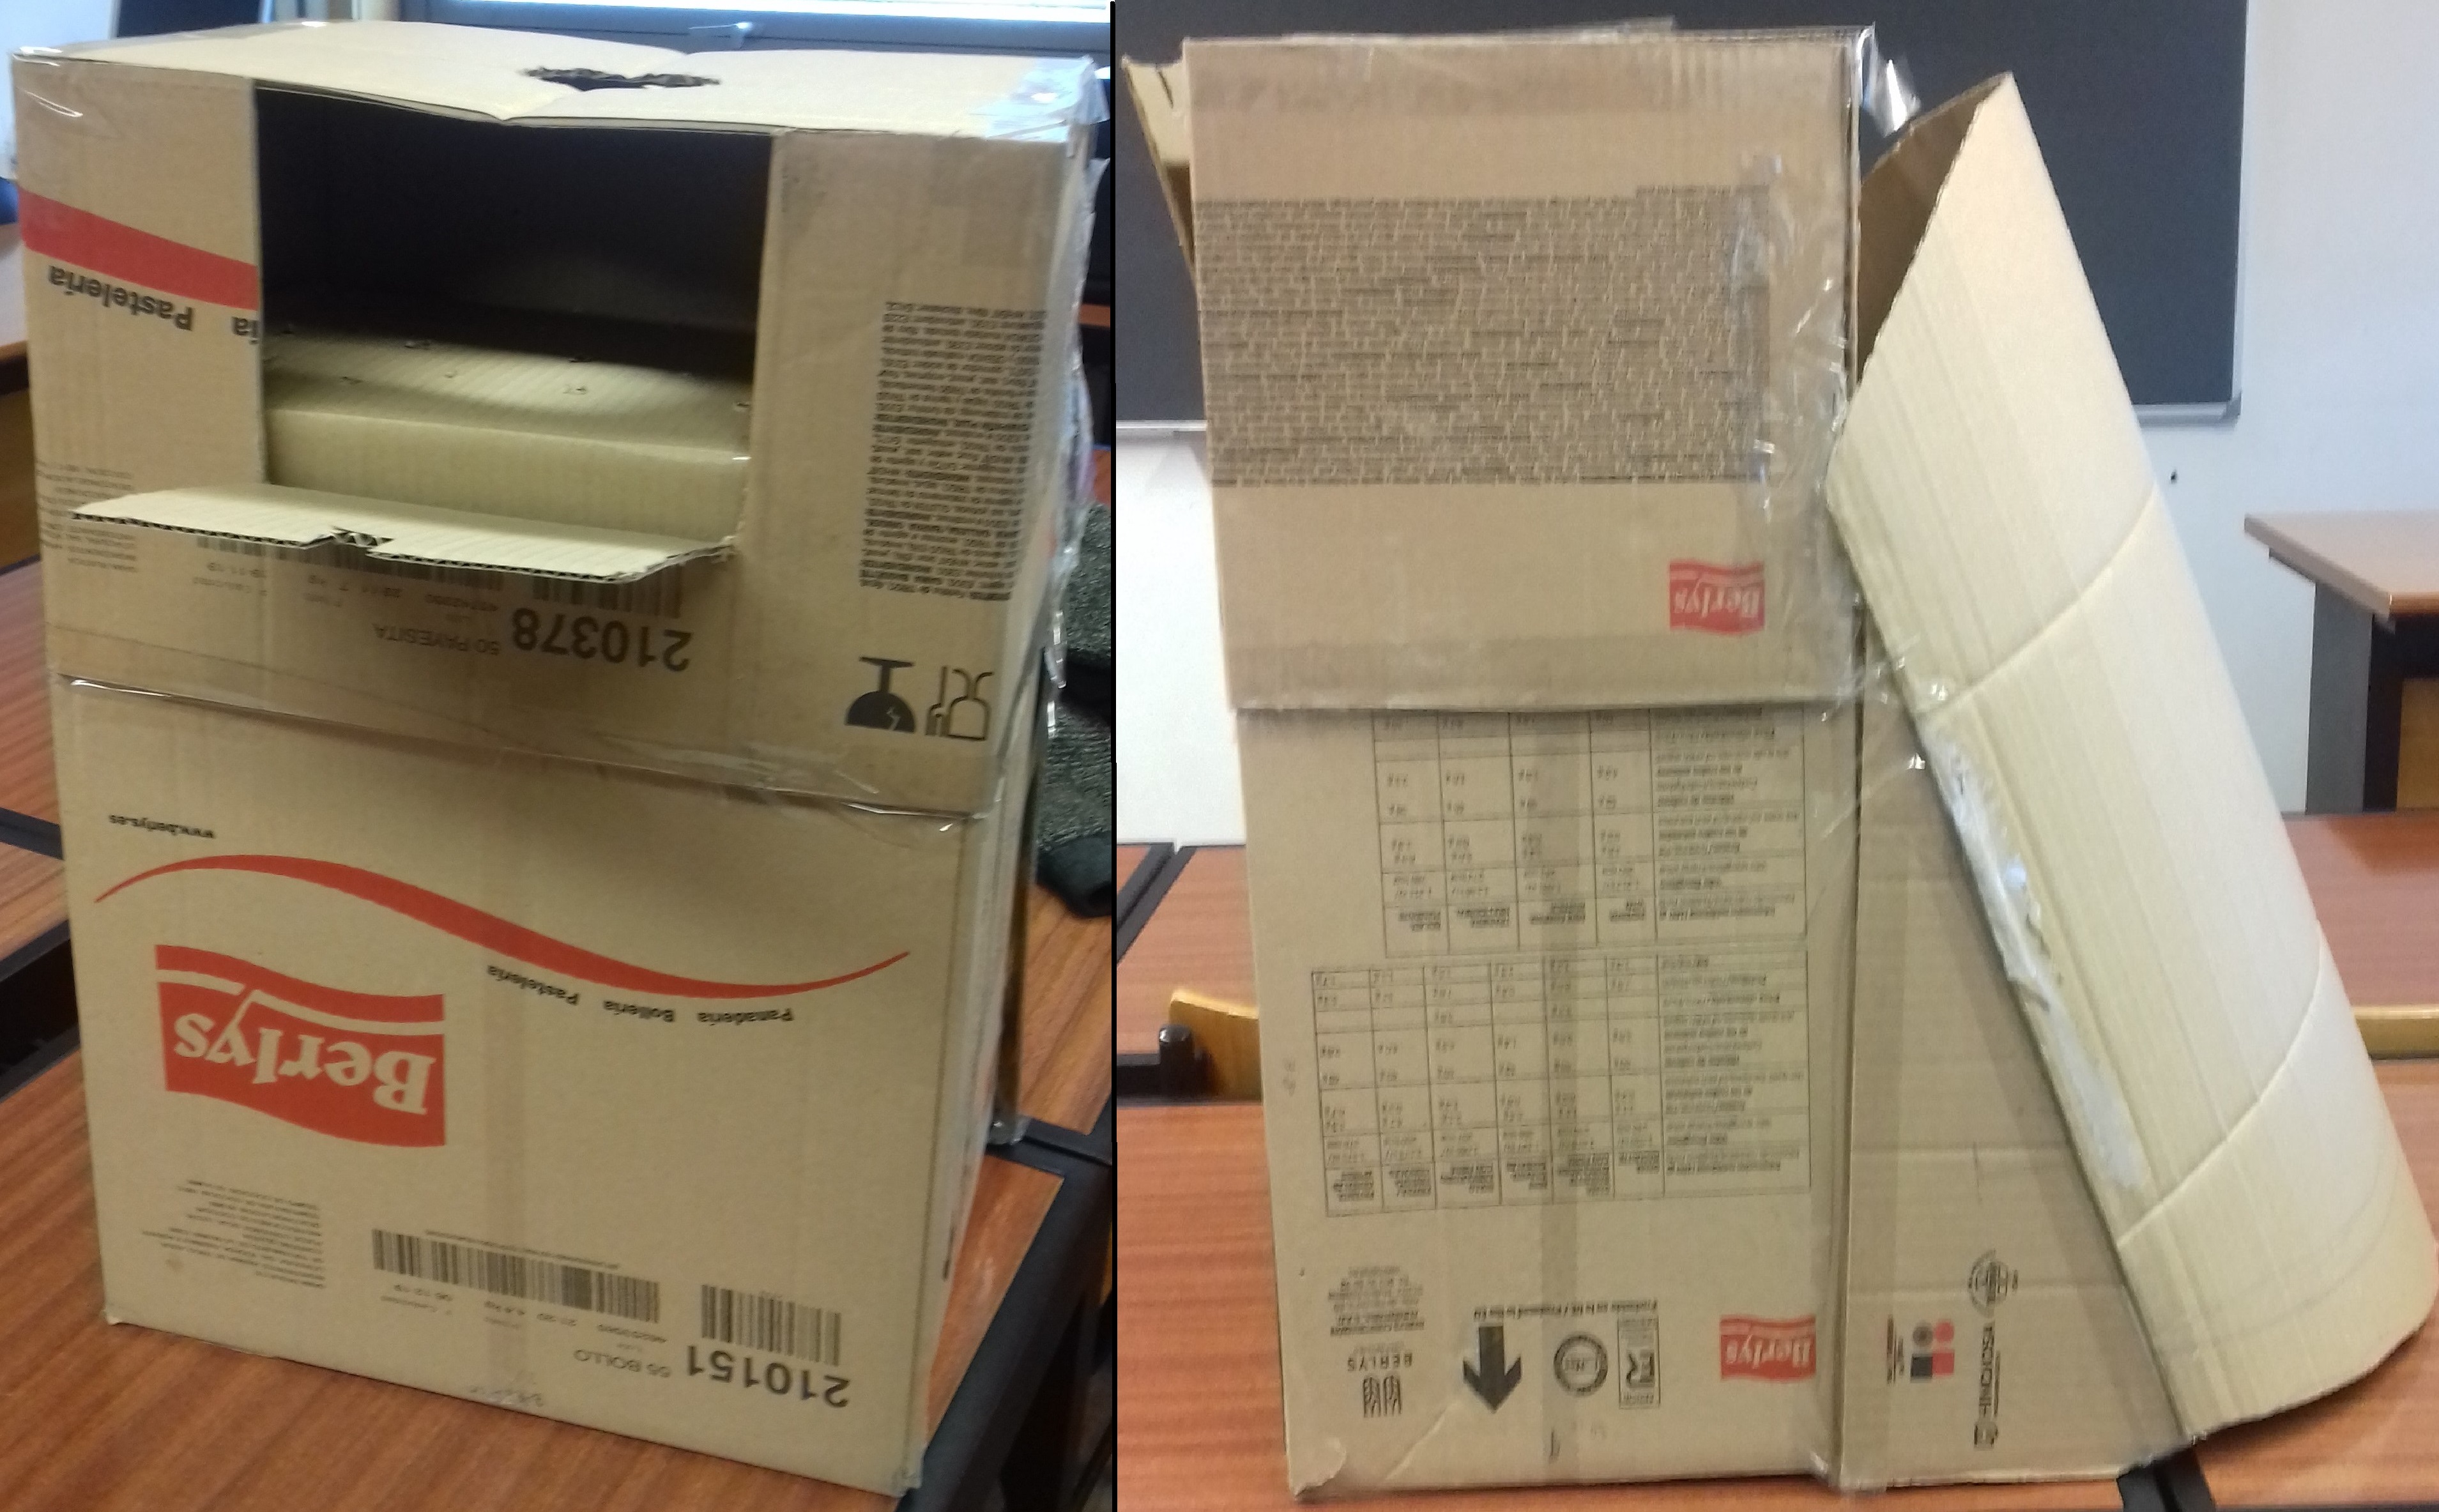
7.2.3 Drawings
7.2.3.1 Design ideas
Figure 30 presents the quick designs of all the different ideas for the design and look.
To quickly present some of those designs:
The first idea, on the top left corner, was to have a way to take advantage of the sunlight during the whole day without having to turn the dehydrator. The one on the bottom left corner was supposed to have a foldable collector to make it easy to carry. The drawings on the top right corner and on the bottom right were “combined” and became the main idea for the product. The shape is made so that, like in the very first design, the sunlight can come in from every angle and the top is made straight so that a solar panel can be placed.
7.2.3.2 Structural ideas
Figure 31 represents the quick designs for the ideas about the structure and mechanisms.
7.2.4 SolidWorks Model
In Figure 32, some renders from the SolidWorks model are proposed.
At the bottom are some holes with slopes where the fresh air can enter the solar catcher. After this, the solar catcher heats the fresh air. The transparent front plate is bent for over 180°. This way, the Sun shines on the solar catcher during the whole day without a rotation system. The warm air will rise to the top. The form is conical upwards to increase the airspeed as compensation for the reduced temperature at the top. The chimney is also provided with holes with slopes so that the warm air can escape but the rain can’t come in.
On Figure 33, it is visible that the solar dehydrator has four trays. In total, there is a space of 50 cm by 50 cm to place the fresh food to dehydrate. They are made out of wood and a metal mesh. Through a hinged door, it is easy to place the food on the trays.
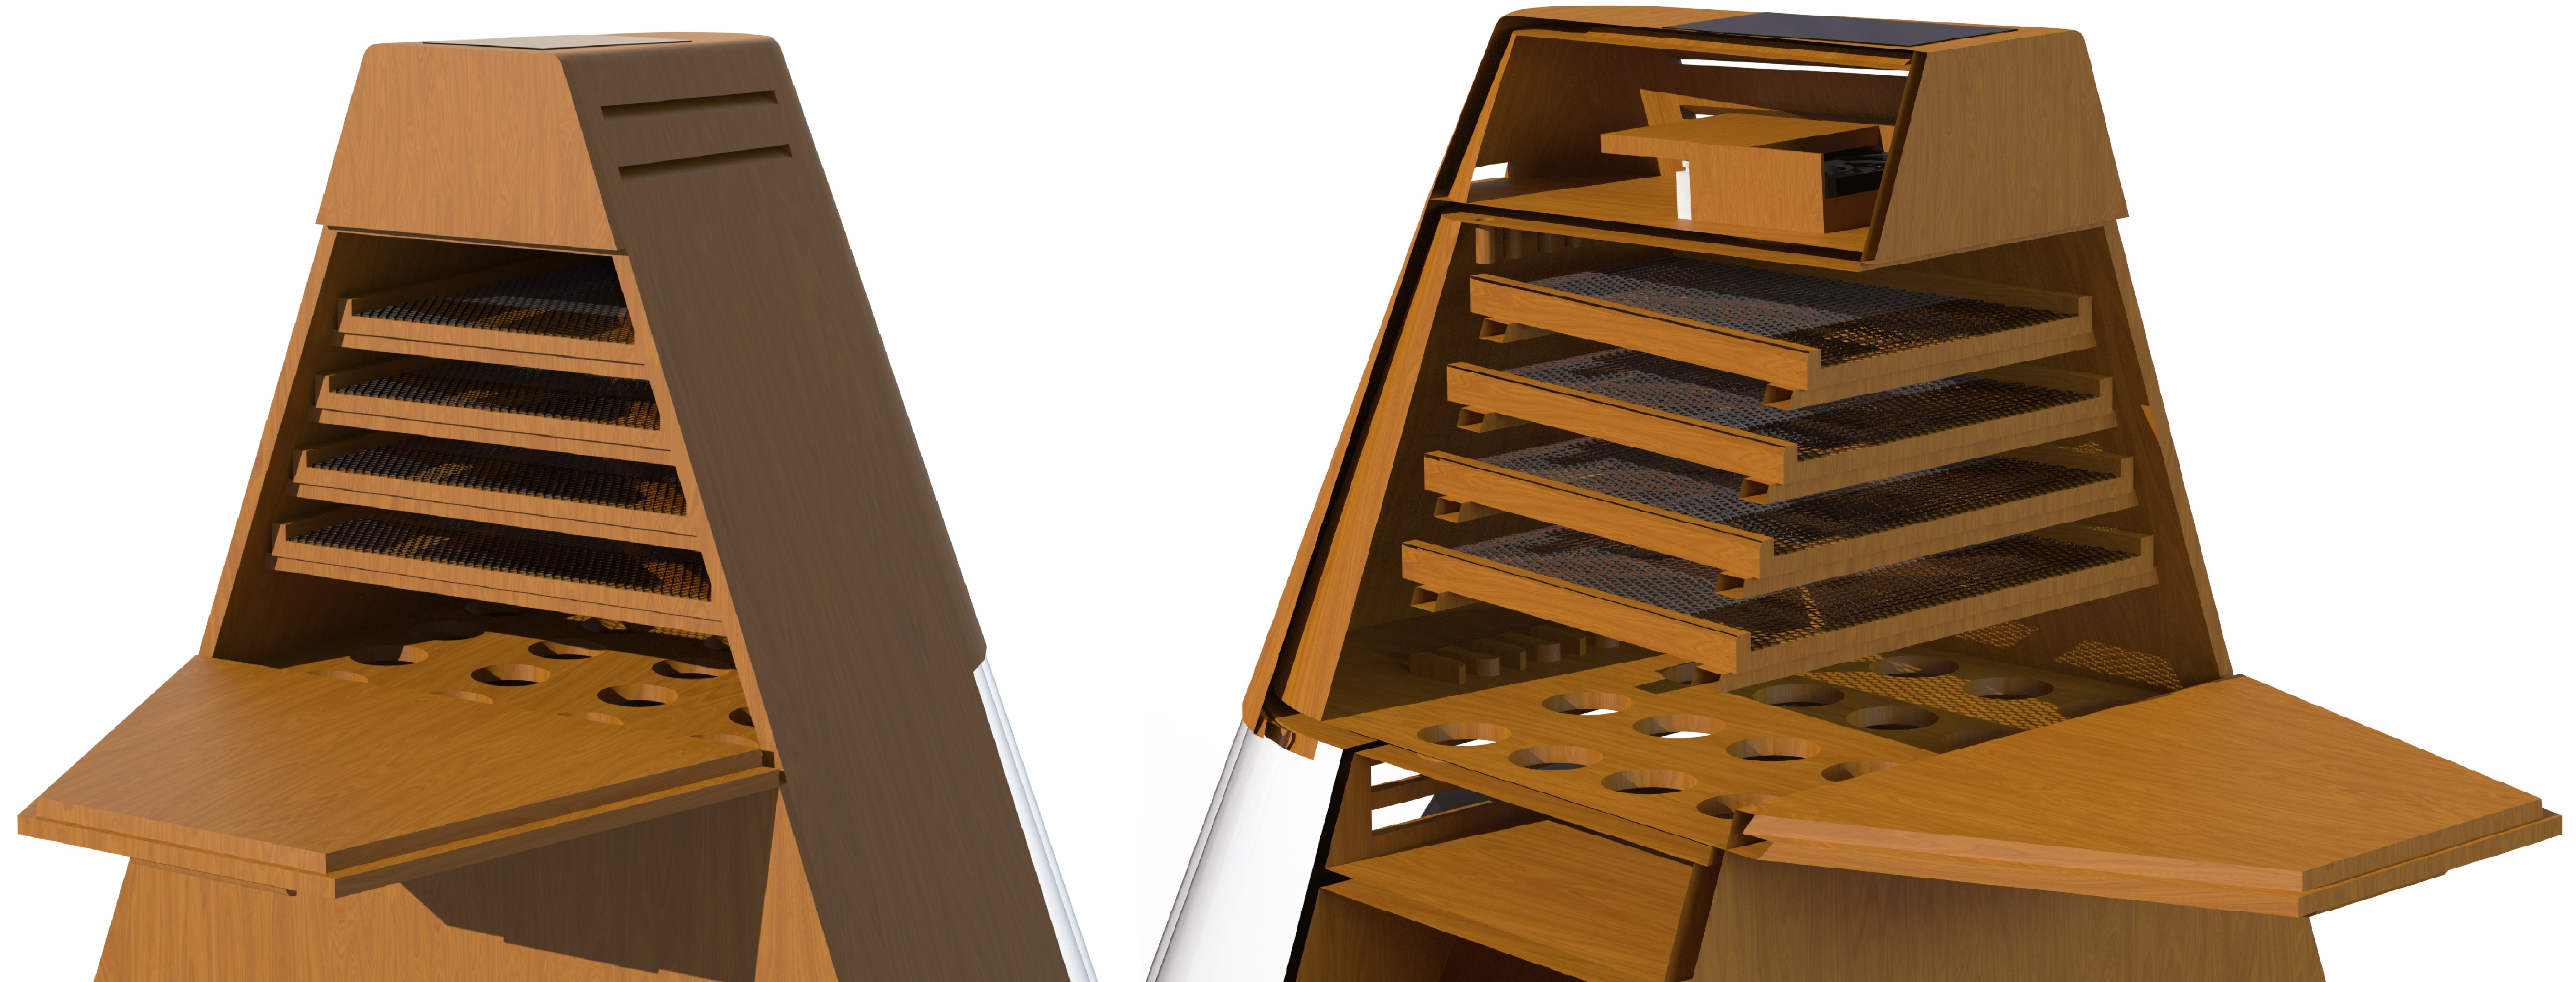
Figure 34 gives a detailed view of the fan. Through the closing lid, pushed by a servo motor, the air flow is optimized. The servo motor is turned on or off depending on the humidity and temperature inside the cabinet. These two parameters are measured by sensors. This controlling system, in combination with the fan, ensure the optimal conditions to dehydrate the food.
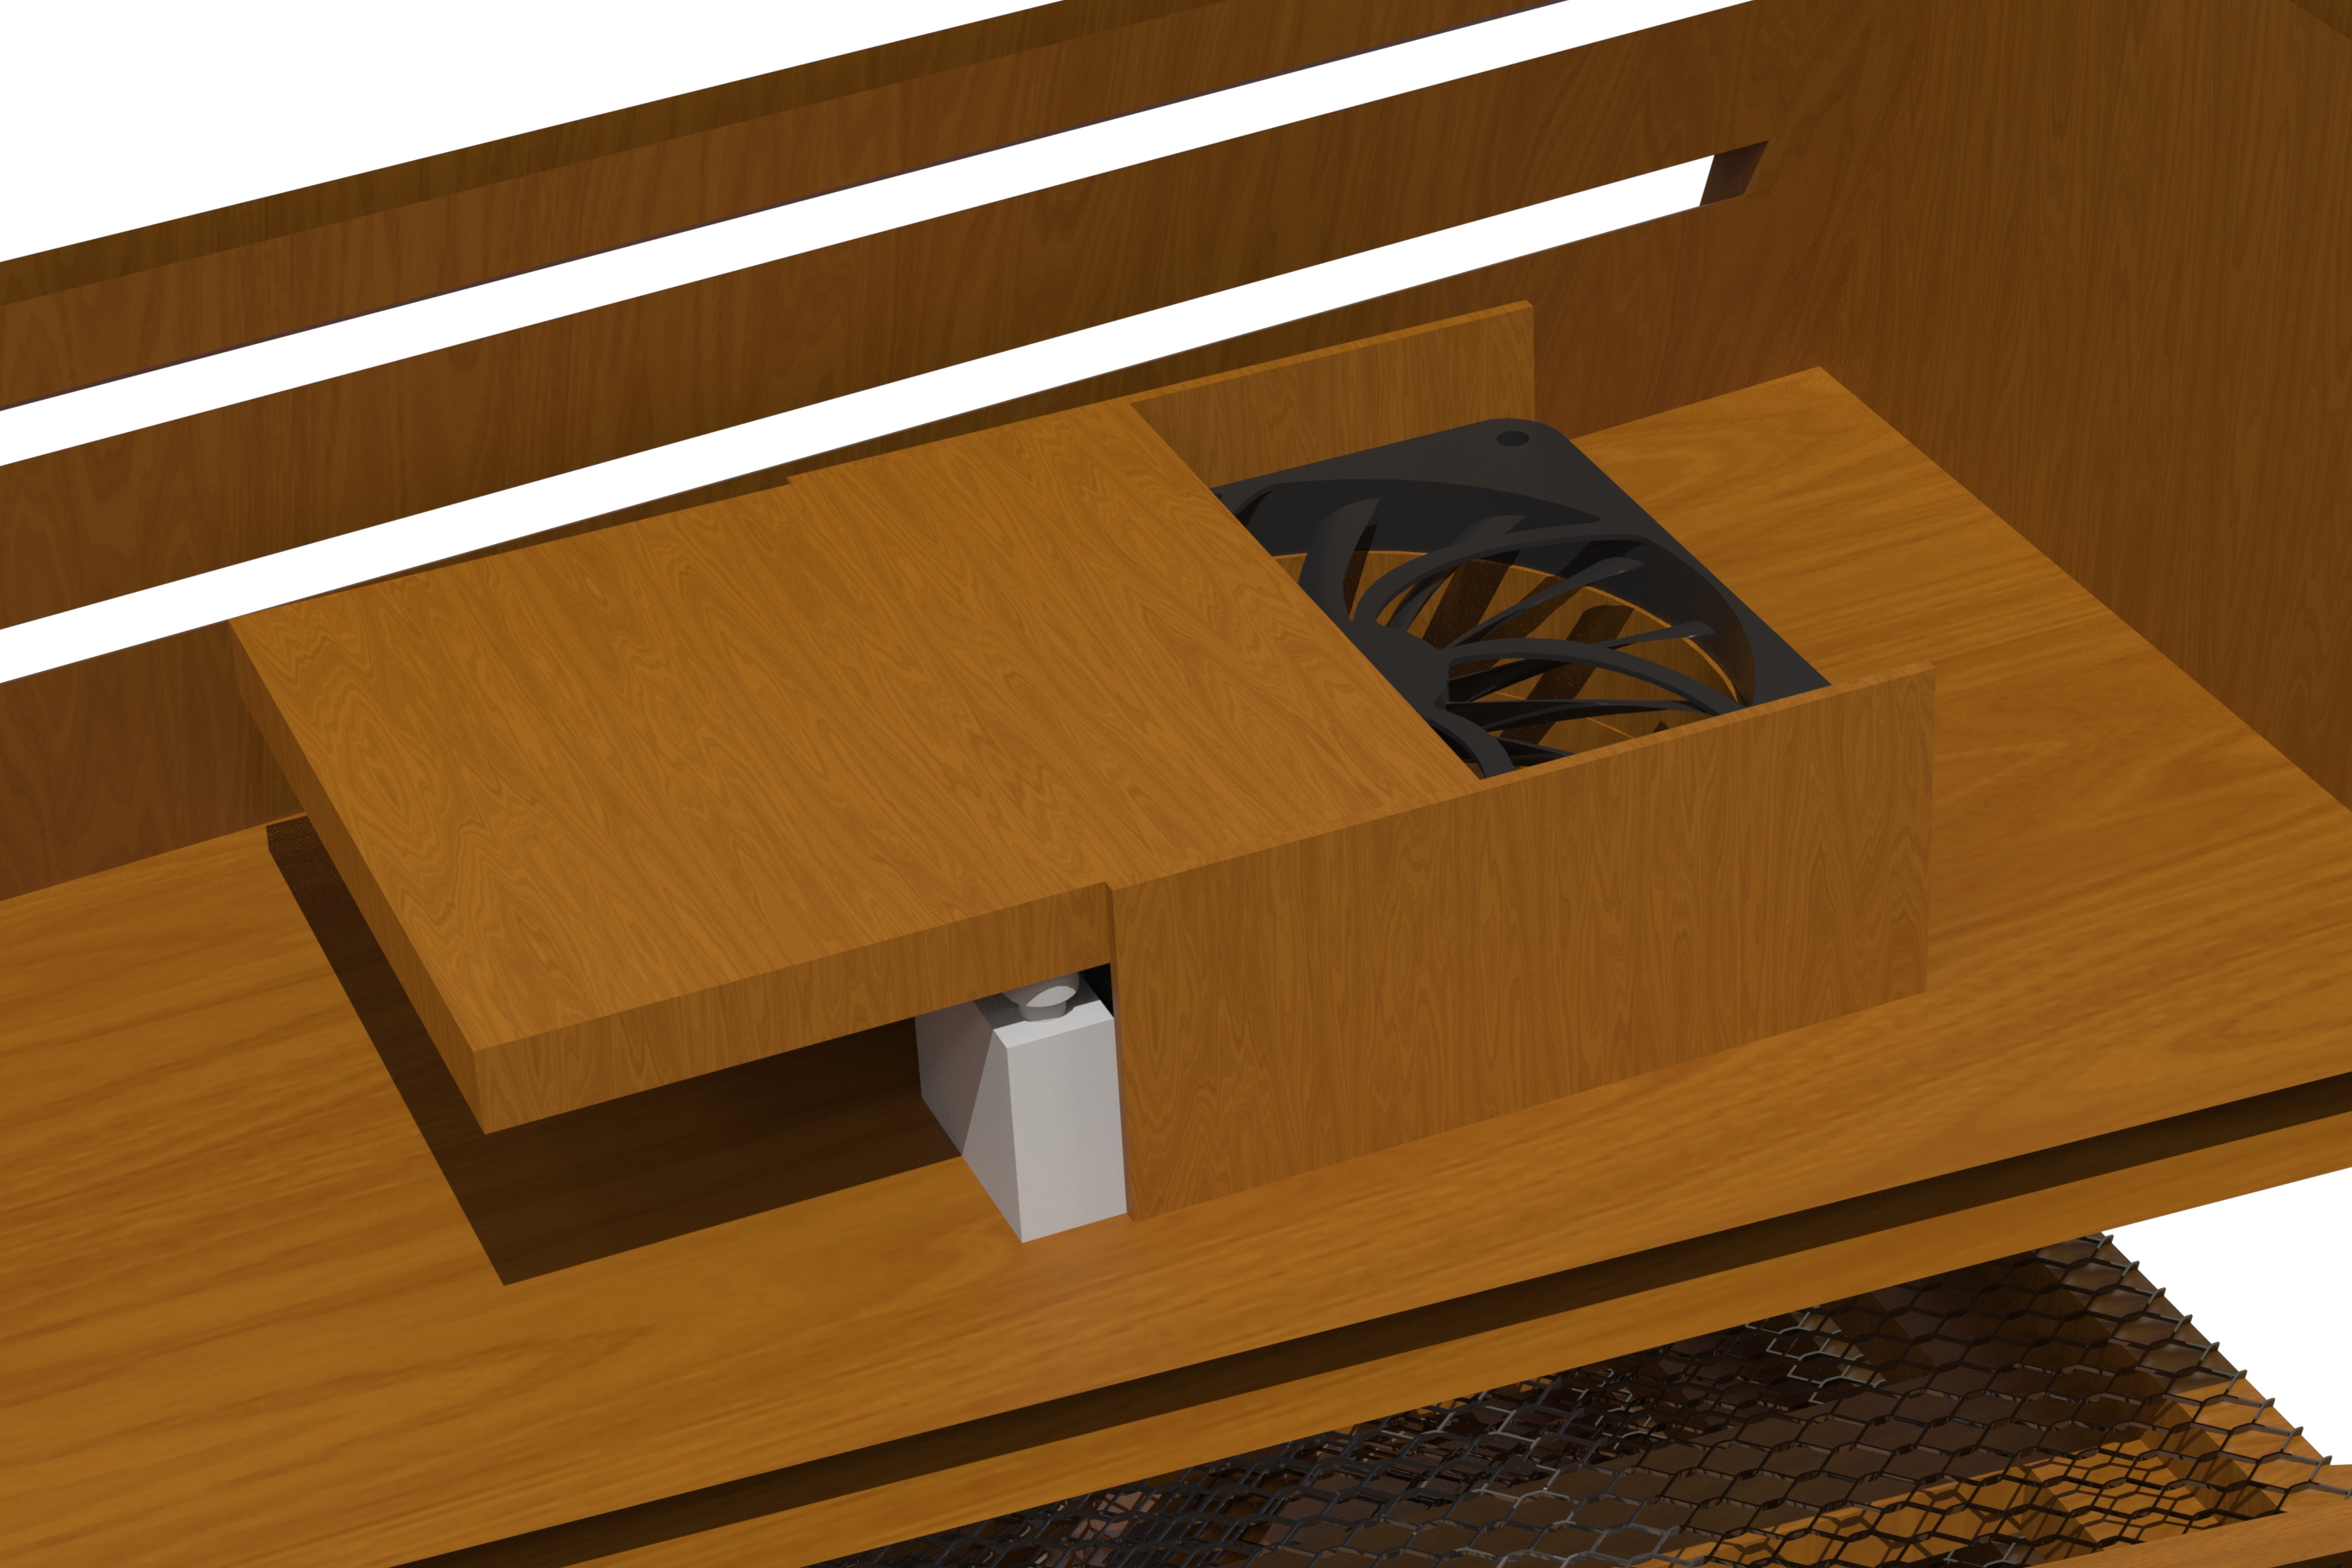
Figure 35 gives a good view of the top of the dehydrator. On top of the chimney is a solar panel that provides power to the fan and the controlling system.
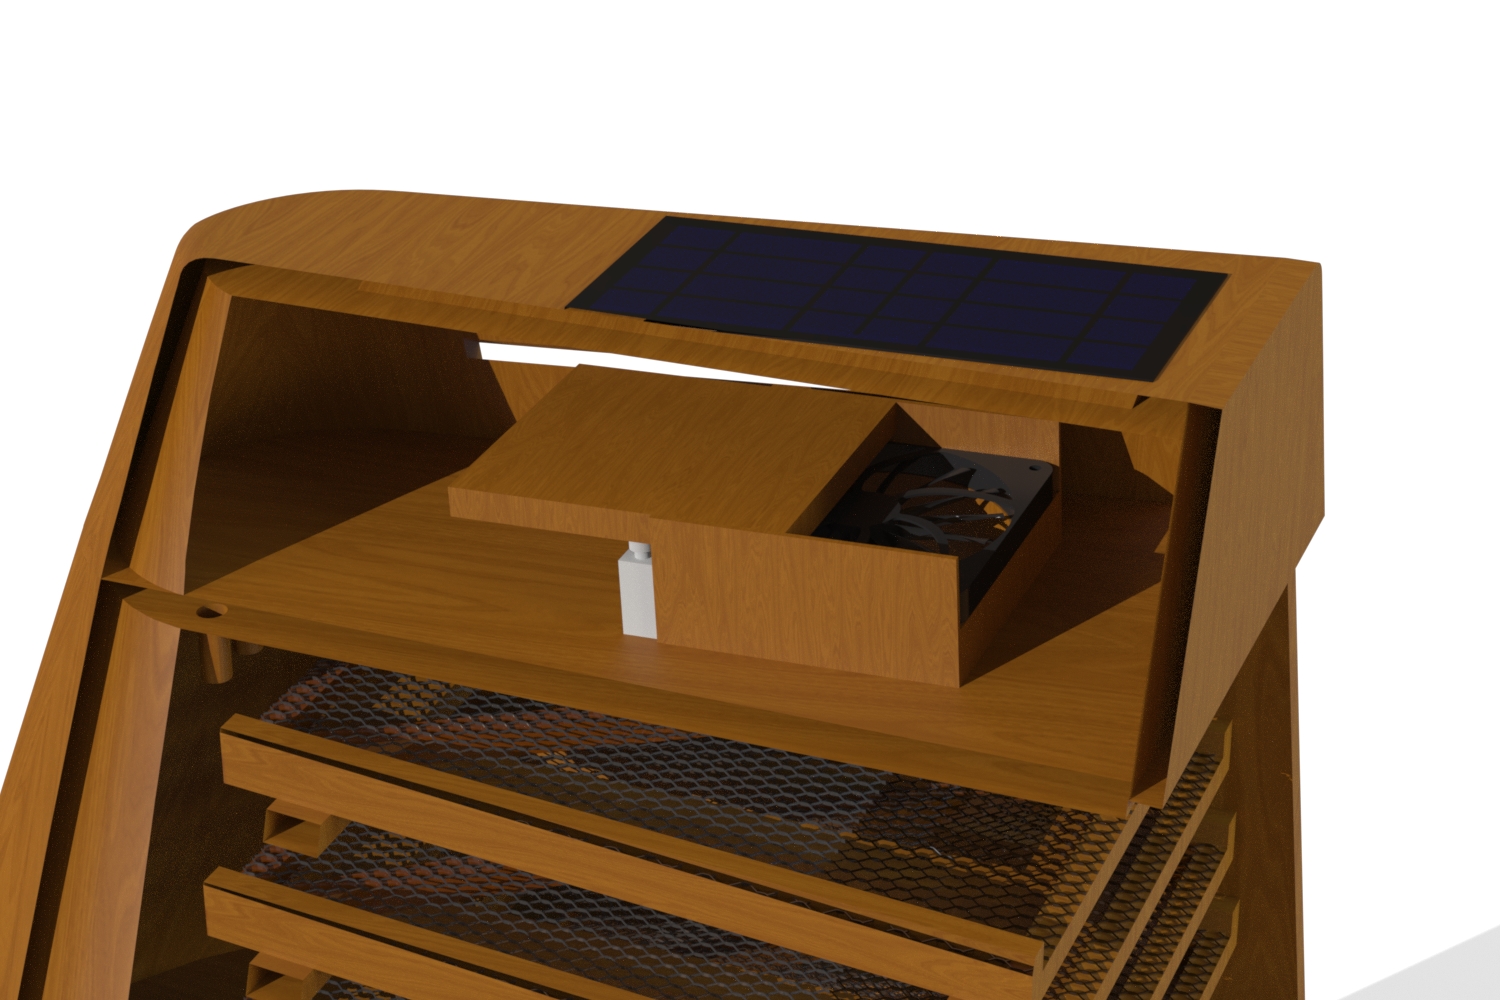
7.2.5 Detailed Schematics
Figures 36, 37 and 38 provide detailed schematics of the product's electronic parts and circuits. As seen in Figure 36 and 37, the schematics use virtual nets in order to keep a clean sheet. On Figure 36 below, the green headers on the side represent the female headers and connectors of the Arduino Uno, and the big header in the middle symbolizes the connection towards the self-made PCB. In Figure 38, the layout of the PCB is shown. With the ground net filling up the rest of the unused copper pane, not only the EMC obstacles have been overcome, but also the amount of copper that is etched away is reduced to a minimal. Therefore the PCB also fulfills some sustainability goals.
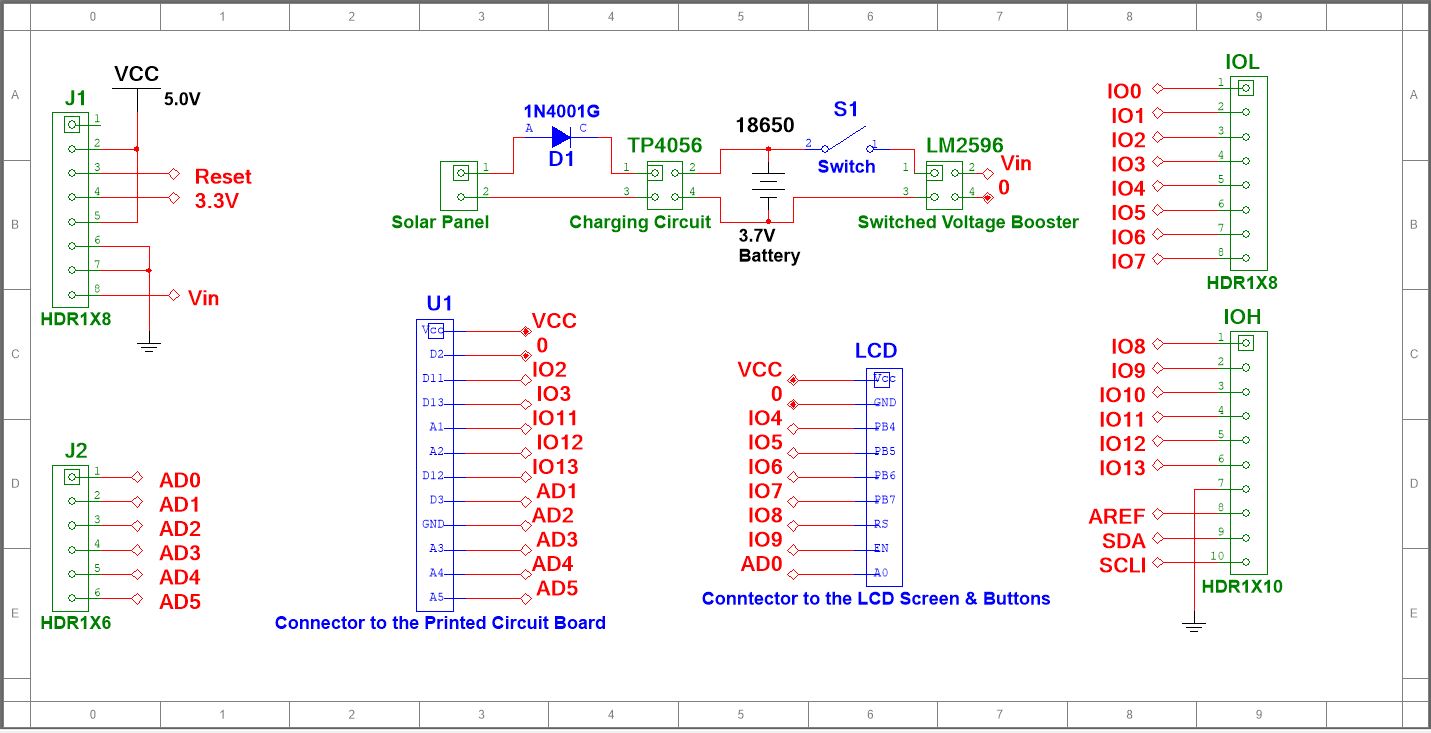
As seen in Figure 37, the PCB houses all the external components that are used to either, regulate or control the most important inner functionalities of the device. Resistors 1 to 5 are used to limit the current that flows through to the LEDs or to the transistors that switch on the power of the fan and the servo motor. Capacitors are used to rectify any uncertainties between the base and the ground of the transistors. The LEDs are used to indicate different operating states of the device in order to notify the user when the device is running, in standby, has an error or is turned on.
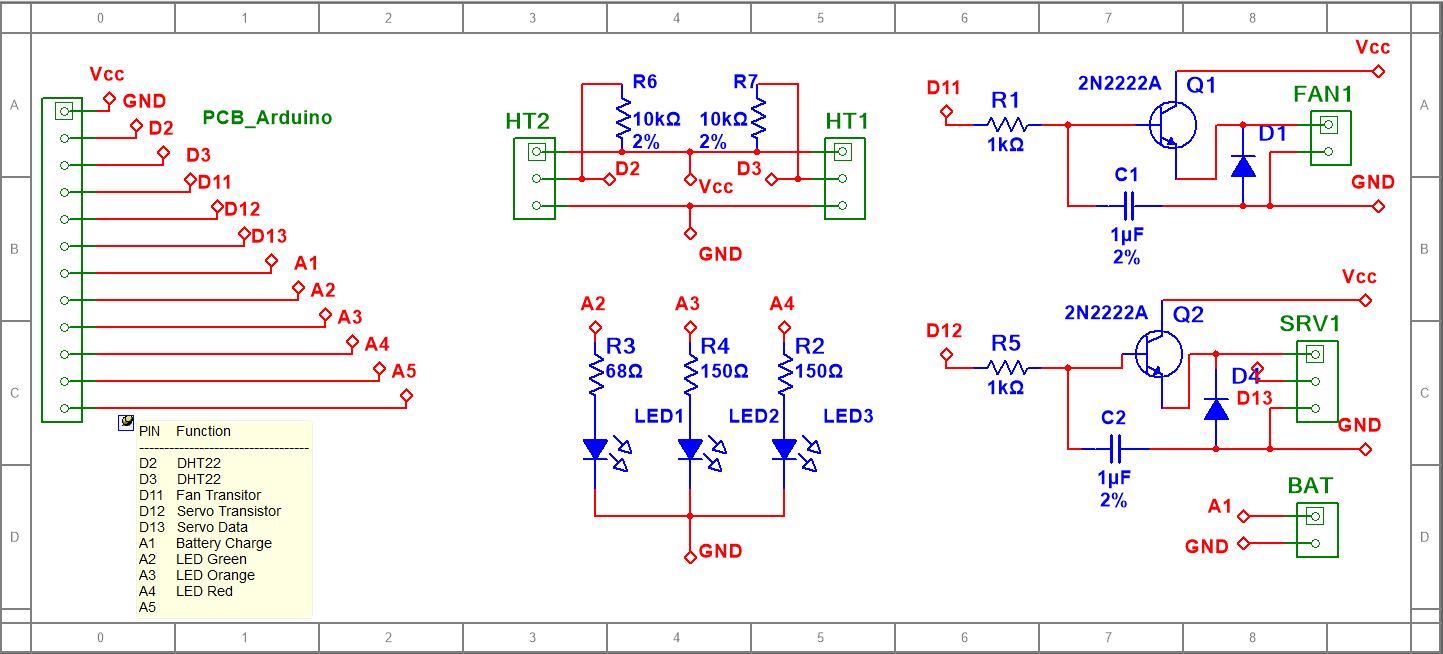
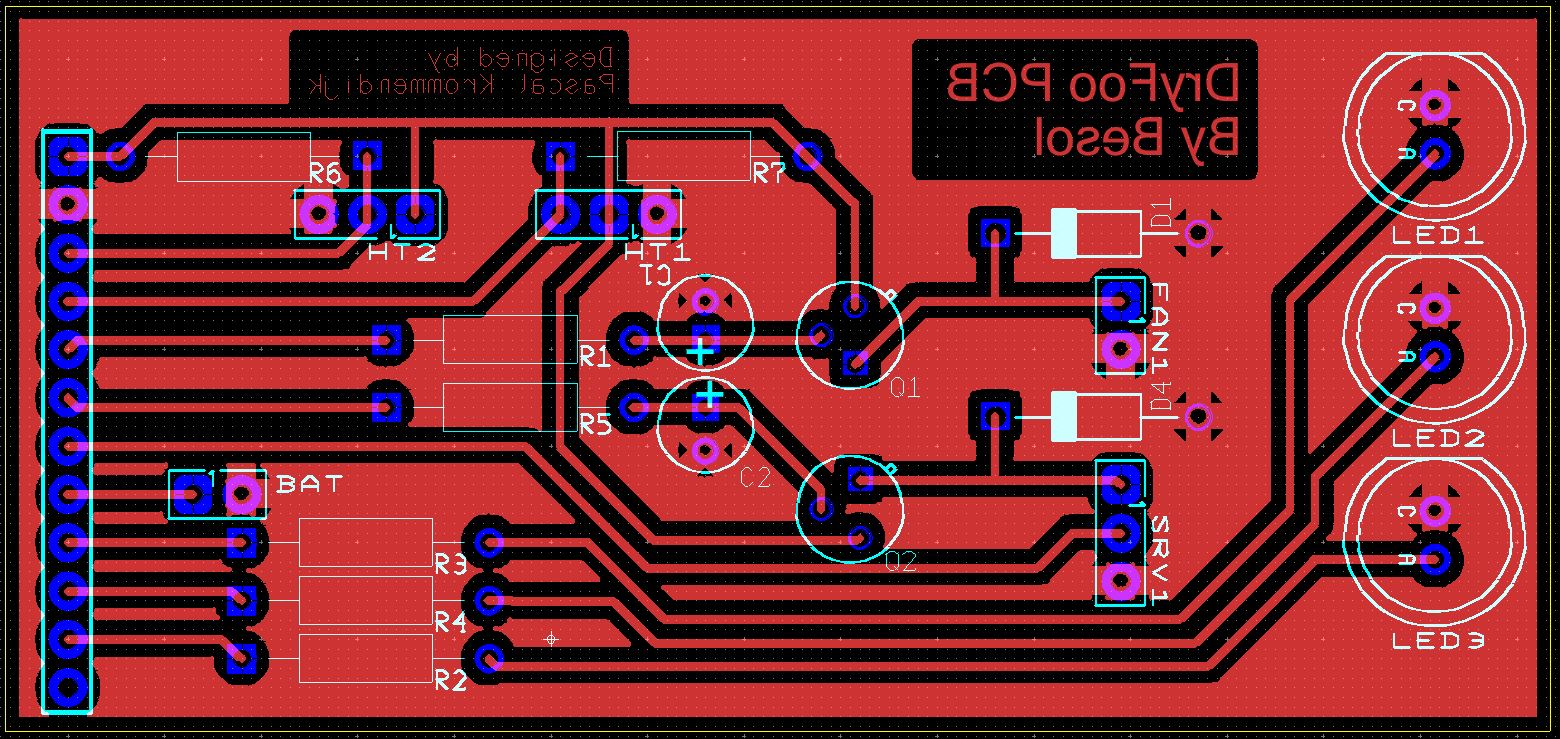
Finally, Figure 39 presents a 3D view of the PCB.
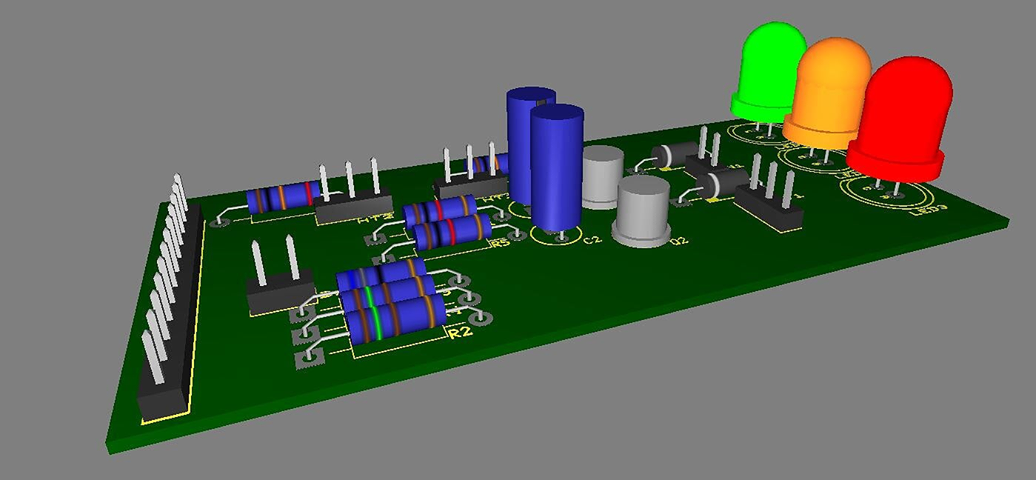
7.3 Materials
Table 31 shows the list of materials made for the prototype with their sources.
| Part | Material name | Area (m²) | Length (m) | Attributes | Price per m² (€) | Quantity | Total Price (€) | Source |
|---|---|---|---|---|---|---|---|---|
| Transparent Front | PVC | 0.11466 | - | Bendable (< 1 mm) | 14.99 | 1 | 1.72 | http://www.leroymerlin.pt/Site/Produtos/Madeiras/Vidro/Acrilico/81931371.aspx |
| Bended Front Rest | PVC | 0.125 | - | Bendable (< 3 mm) | 0 | 1 | 0 | From Benedita/Abel |
| Straights parts of the case | Wood (preferably plywood) | 0.625 | - | Width: 10 mm (depends on ISEP’s stock) | 2 | 1 | 0 | From ISEP |
| Trays and air holes mesh | Plastic mesh | 0.070125 | - | Provided by Benedita | 0 | 1 | 0 | From ISEP |
| Tray bars | Wood (preferably plywood) | - | 4.5 | 10 mm x 10 mm | 0 | 3 | 0 | From ISEP |
| Paint for Collector | Black paint (mat) | 0.07 | - | Provided by Abel | 0 | 1 | 0 | From Abel |
| Collector | Rubber | 0.09226406 | - | 50 cm x 25 cm | 3 | 1 | 0 | From João |
| Screws | - | - | 0.02 | Pack | 2.56 | 1 | 2.56 | https://www.electrofun.pt/ferramentas/kit-parafusos-m2-5-m3-anilhas-180-pecas-velleman |
| Glue | White wood glue | - | - | In a tube | - | 1 | 3.99 | http://www.leroymerlin.pt/Site/Promocoes/19643904.aspx |
| Sliding lock latch | Stainless steel | - | - | Waterproof | 4.45 | 1 | 4.45 | https://www.aki.pt/ferragens/seguranca/seguranca-portas-e-janelas/fechos-seguranca/TrincoCromado70Mm-P19642.aspx |
| Hinges (door) | Stainless steel | - | - | Waterproof | 1.99 | 2 | 3.98 | http://www.leroymerlin.pt/Site/Produtos/Ferragens/Ferragens-para-moveis/Dobradicas-de-movel/13263362.aspx |
| Isolation between gaps and connections | Silicone | - | - | - | - | 1 | 2.49 | https://www.aki.pt/tintas-e-drogaria/colas-silicones-fitas-adesivas/silicones-e-vedantes/vedantes-madeira/vedanteacrilicomadeira/carpintariaaxton310ml-p44777.aspx?fbclid=IwAR3POsmym7U6eXd0U-siIn7IVXCCRS7z803CHZRMpw4NVTItaLKzkhA6dj4 |
The team made sure the materials were totally environment-friendly, like, for example, the glue and the paint. It was also verified that no dangerous fumes would be emitted by materials after those are heated up.
Additionally, the team chose to re-use materials that the supervisors and/or ISEP can provide as much as possible. If not, the team made sure the remaining materials and components were provided by local producers or companies.
7.4 Components
The components are listed in various tables that will each be explained below. It contains all kind of components the team thought could be used for the prototype. The chosen components are highlighted in bold text.
Tables 32 and 33 represent, respectively, the temperature sensors and temperature and humidity sensors.
| Temperature sensor | Temperature range (°C) | Accuracy (°C) | Input voltage (V) | Price (€) |
|---|---|---|---|---|
| LM35DZ | 0.00 - 100 | ±0.50 | 4.00 - 30.0 | 1.75 |
| DS18B20 | -55.0 - 125 | ±0.50 | 3.00 - 5.00 | 3.75 |
| LMT86LP | -50.0 - 150 | ±0.25 | 2.00 - 5.50 | 0.73 |
| Temp + Humid sensor | Input voltage (V) | Temp operation range (°C ) | Temp accuracy (°C) | RH accuracy (%) | Price (€) |
|---|---|---|---|---|---|
| DHT11 | 3.00 - 5.00 | 0.00 - 50.0 | ±2.00 | ±5.00 | 3.80 |
| DHT22 | 3.00 - 5.00 | -40.0 - +80.0 | ±0.50 | ±5.00 | 8.92 |
| RHT03 | 3.30 - 5.50 | -40.0 - +80.0 | ±0.50 | ±5.00 | 14.76 |
| SI7021-A20-GM1 | 1.90 - 3.60 | -40.0 - +125 | ±0.40 | ±3.00 | 9.84 |
| HTU21D | 1.50 - 3.60 | -40 - +125 | - | ±2.00 | 5.85 |
| HIH6030-021-001 | 2.30 - 5.50 | -40.0 - +100 | - | ±4.50 | 7.66 |
Combined temperature and humidity sensors are usually showcased as high-quality products and it can be presented as a good solution when price is taken into consideration. Because of that, it was chosen to use those over simple temperature sensors and humidity sensors used separately.
Table 34 represents the list of LCD. The chosen component is the one that filled the most the needs for the prototype.
| LCD | Feature | Supply Voltage (V) | Price (€) |
|---|---|---|---|
| Shield Display LCD 16×2 | SHIELD + KEYBOARD | 5 | 6.90 |
| LCD 16×2 | - | 5 | 5.55 |
| LCD 16×2 | I2C | 5 | 7.20 |
Table 35 shows the list of servomotors that were considered.
| Servomotor | Input voltage (V) | Temp operation range (°C) | Torque (kg/cm) | Current consumption (mA) | Price (€) |
|---|---|---|---|---|---|
| Futaba S3003 Multi Purpose Servo Motor | 4.80 | -20.0 to 60.0 | 3.20 | - | 15.93 |
| Hitec HS-422 Deluxe Servo Motor | 4.80 | -20.0 to 60.0 | 3.00 | 520 | 15.93 |
| Servo FS5106B - Generic High Torque Standard | 4.80 - 6.00 | -30.0 to 80.0 | 5.00 | 980 | 15.74 |
| Servo Motor SG90 9g Tower Pro | 4.80 | -30.0 to 60.0 | 1.60 | - | 3.75 |
Table 36 is a list of the power supplies (batteries).
| Battery | Type | Output voltage (V) | Capacity (mAh) | Price (€) |
|---|---|---|---|---|
| 18650 Cell Holder | Li-ion | 3.70 | 2500 | 6.00 |
| Torch P20 | Li-ion | 3.70 | 9800 | 3.80 |
Table 37 represents the list of components that the team needs.
| Component | Quantity |
|---|---|
| Arduino | 1 |
| Solar Panel | 1 |
| Battery Charger | 1 |
| Voltage Booster | 1 |
| Fan | 1 |
| Servomotor | 1 |
| Display LCD | 1 |
| Temp. + Humid. Sensor | 2 |
| Diode | 1 |
| Switch | 1 |
| LED | 3 |
Finally, Table 38 shows the power budget for the chosen components.
| Component | Voltage (V) | Current (mA) | Power (W) | Amount | Total Power (W) |
|---|---|---|---|---|---|
| Arduino Uno | 5.00 | -20.0 | -0.10 | 1 | -0.10 |
| Solar Panel | 5.50 | 600 (max) | +3.30 (max) | 1 | +3.30 (max) |
| Battery | 3.70 | 5200 (max) | +19.24 (max) | 1 | +19.24 (max) |
| Battery Charger | 5.00 | -0.15 | -0.75 (mW) | 1 | -0.75 (mW) |
| Voltage Booster | 5.00 | -0.60 | -3.00 (mW) | 1 | -0.75 (mW) |
| Fan | 5.00 | -74 | -0.37 | 1 | -0.37 |
| Servo Motor | 5.00 | -3 ² & -45 ³ | -0.015 & -0.225 | 1. | -0.015 & -0.225 |
| LCD Keypad Shield | 5.00 | -130 | -0.65 | 1 | -0.65 |
| DHT22 Sensor | 5.00 | 1.10/2.10 | -0.01 | 2 | -0.20 |
| LED | 5 | 2.5 | -0.01 | 5 | -0.05 |
| Diode | 1.1 | 21.0 | -0.11 | 1 | -0.11 |
| Consumption | -1.63 | ||||
| Production (max) | 22.54 | ||||
² = in Standby mode (connected but not moving)
³ = while turning, with a delay of 20 ms per 1° angle (most power efficient)
When knowing that the total calculated power consumption of the device will be roughly about 1.65 W, the total running time of the device during the night can be calculated. So, when no power comes from the solar panel the battery can provide power to the DryFoo for roughly 5 and a half hours. This is calculated by dividing the power consumption by the battery voltage to get the discharge current needed from the battery. By dividing the nominal capacity of 2400 mAh with the discharge current of 430 mA, the time will roughly be 5.48 hours. This is calculated with both the servo motor and the fan running constantly.
7.5 Functionalities
7.5.1 Drying Process
First of all, how does the food get dried when Dryfoo is operating?
It is a simple process that is best explained by the airflow of Figure 40. To explain, the example of an apple will be used. An apple has a certain quantity of water molecules in it, just like every type of fruit or vegetable. When these water molecules get exposed to a certain rate of energy, in form of heat, the water transforms from a liquid state to an evaporated state. This transformation lets the molecules drift in an upward direction and leave the slice of apple, speeding up the overall drying process. This is only possible when the volume of air still has some space left in which the molecule can move through. The lack of free space for a molecule to get into is called relative humidity. If many evaporated water molecules are present, the humidity goes up and the overall drying process will slow down. Therefore, in order for the apple to get dried in the most efficient way, Dryfoo is designed in a way to increase the heat in the cabinet and decrease the humidity. This is done by heating up the cool air coming in from the bottom and then let it pass through the apple and pull out the water molecules. After that, a fan on top of the cabinet pulls out the hot humid air in a vortex flow.
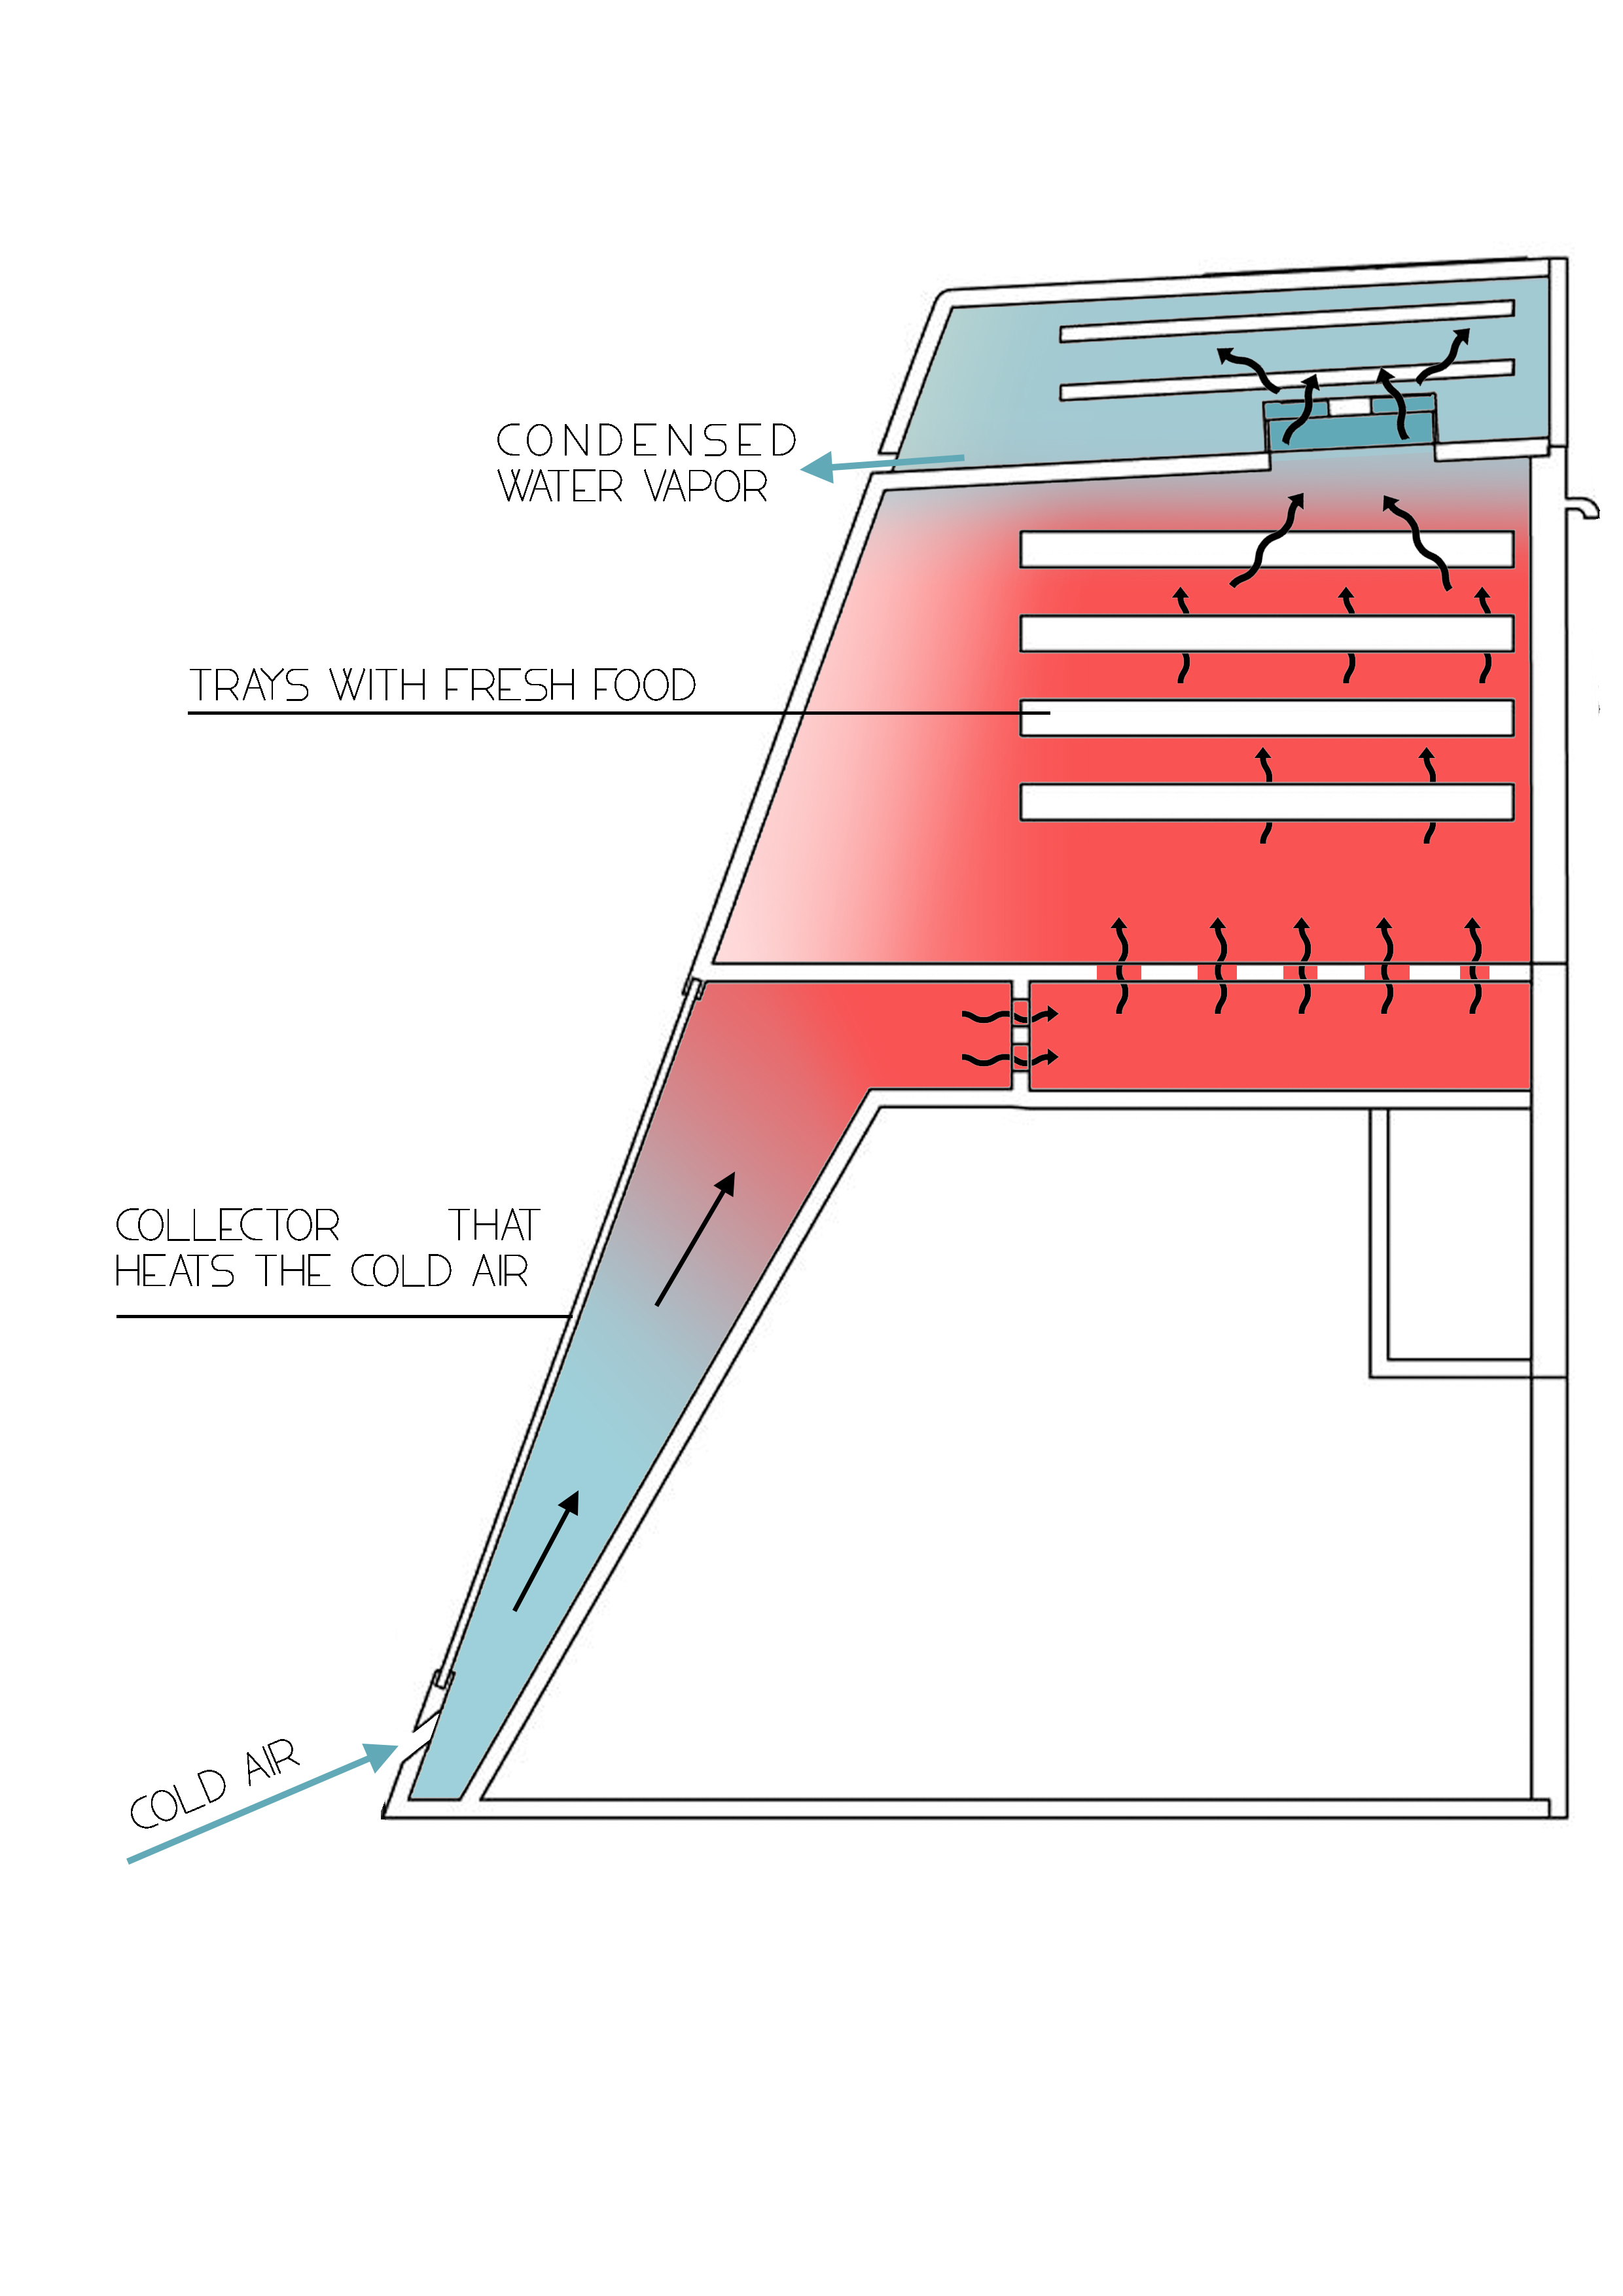
7.5.2 Software Layout
In this part, the software layout and functionalities will be explained. Table 39 shows the welcome screen of Dryfoo. It is the first menu displayed on the screen after the Dryfoo and BeSol names and the loading progress bar. It is a menu-based layout chosen for overview using a 16×2 LCD & 4 Buttons. To confirm, the user has to press the Right button, to go back, the Left button, and finally, to scroll, the Up and Down buttons.
Every item will be explained below.
Item 1: Start Drying
Fruits and vegetables are grouped in different categories depending on the length of the drying and the maximum temperature that can be allowed for each. Table 40 shows an example of the menu displayed when that item is chosen.
| From… | Sub Menu List |
|---|---|
| Start | ↑ +1h Time: 24h |
| Drying | ↓ -1h |
Item 2: Program Status
This item shows the status of the program and the sensors, even if no program is chosen.
Table 41 shows an example of the menu displayed when that item is chosen.
| From… | Sub Menu List (example) |
|---|---|
| Program Status | Chosen time: 24h Progress: 22 h 35 min |
Item 3: Conditions
This item shows the status of the program and the sensors, even if no program is chosen.
Table 42 shows an example of the menu displayed when that item is chosen.
| From… | Sub Menu List | Info after clicking right |
|---|---|---|
| Conditions | Temp: 35 °C Humid: 67 % | When the up button is pressed, upper sensor is shown |
| Temp: 35 °C Humid: 67 % | When the down button is pressed, lower sensor is shown |
Item 4: Diagnostics
This item can only be chosen when no program is running, so the user has to wait until the process is finished. It diagnoses every component:
- Battery Charge/Voltage
- Servo Motor: setAngle and getAngleStatus
- Both sensors: see if they are getting correct results
- Fan: it may be measured through the power consumption (if stuck, higher power is drawn).
- LEDs: they light up in a specific order. The user presses “right” if they are working in the right way/order.
The diagnostics are shown with a visual delay in order, for the user, to see the results.
Item 5: Stand by/Power saving
This item can only be chosen when no program is running. On the display is written: “Going in Standby…“ (the wait is 2 seconds).
This option turns the Arduino in low power consumption. It opens all transistors and turns off LCD-Backlight. Let the orange LED glow slightly.
Item 6: Stop Process
In this item, the user is able to cancel the time previous selected. In case of no time has been chosen the program will display a message informing the user of that impossibility.
Item 7: About…
This item presents information about Dryfoo. On the display is written:
“Dryfoo Ver: 1.0
Product by BeSol”
There is a short delay for the user to see the information before it returns to the main menu.
7.6 Tests and Results
Testing is a very important part of the project as it allows the team to see if everything, software and hardware, is working properly. This part will consequently be divided into three parts: software, electronics, and the dehydrator itself.
7.6.1 Software
To see if everything was working correctly with the software, the team tested every item, as seen above in the Functionalities part, through the user interface (LCD display). The testing in this part can be summed up with the following video:
Video 1: User interface testing
Everything worked properly and no problem was detected.
7.6.2 Electronics
7.6.2.1 Temperature and Humidity Sensor
In order to measure the temperature and humidity, two DHT22 sensors were used. It consists of a humidity sensing component, an NTC (Negative Temperature Coefficient) thermistor and an IC (Integrated Circuit). For measuring humidity, two electrodes with moisture holding substrate are placed between a humidity sensing component. As the humidity changes, the conductivity of the substrate changes or the resistance between these electrodes changes. This change in resistance is measured and processed by the IC which makes it ready to be read by a microcontroller.
The NTC thermistor is used to measure the temperature. A thermistor is a variable resistor that changes its resistance with the change of the temperature. The term “Negative Temperature Coefficient” means that the resistance decreases with the increase of the temperature.
It was necessary to include the libraries of the sensor into the Arduino code.
The DHT22 values were compared with different sensors in order to better understand the reliability of these readings.
There were around 0.5 V of difference between both DHT22 sensors. This comparison can be seen in Table 43.
| Component | 1st Measurement (ºC) | 2nd Measurement (ºC) |
|---|---|---|
| DTH22 (top sensor) | 26.8 | 28.5 |
| Mini CO2 Monitor | 27.0 | 28.9 |
| DTH22 (bottom sensor) | 27.3 | 29.1 |
7.6.2.2 Charging system
The charging system consists of using the energy of the Sun to power up the electrical components used in the circuit. To achieve that goal, a solar panel was connected to a charging battery, with a diode for protection between them, that works as a switch in order to continuously charge a 3.7 V battery. A voltage booster will ensure that the Arduino is powered up with 5 V, as showcased in Figure 41 below.
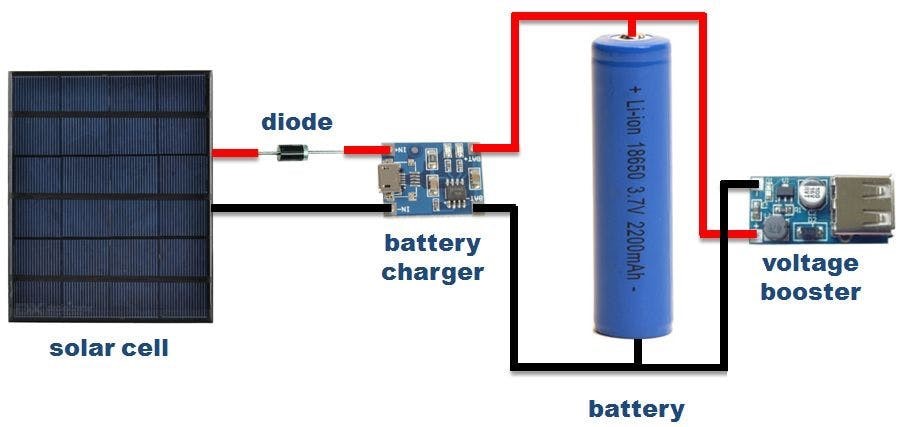
Tests were made to verify the effectiveness of the system. It was possible to conclude that, to voltages around 4.4 V in the solar panel, the battery stayed with 3.7 V as wished. In the case of the solar panel being covered up to simulate the dark of the night, the battery was able to power up a fan for over seven hours without dropping from 3 V. The charging process took less than six hours to occur.
7.6.2.3 Servo Motor
The servo motor tests ensure that the component reacts according to the demands of the program. No problem was detected.
7.6.2.4 Fan
In order for the fan to be powered up directly by the Arduino, it is necessary to be a 5 V fan. However, for sustainable and economical proposes it was a reused small 12 V fan that was found in the storage department of ISEP. The fan was tested to ensure its capability to spin with the 5 V from Arduino. Once again, no problem was detected.
7.6.3 Dehydrator
At the end of the semester, the team finished building the prototype of Dryfoo using the materials of Table 31. The prototype can be seen in Figure 42.
The team tested the prototype by inserting food to dehydrate. Figure 43 shows the state of the different food before starting the dehydrating process.
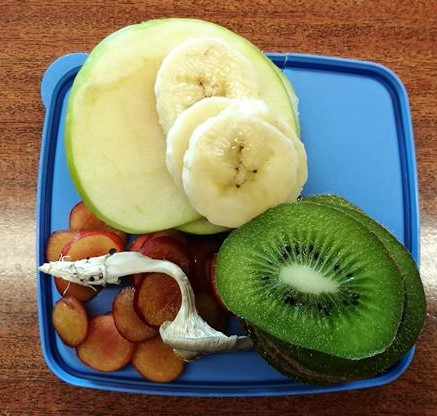
Figure 44 shows their status after approximately seven hours.
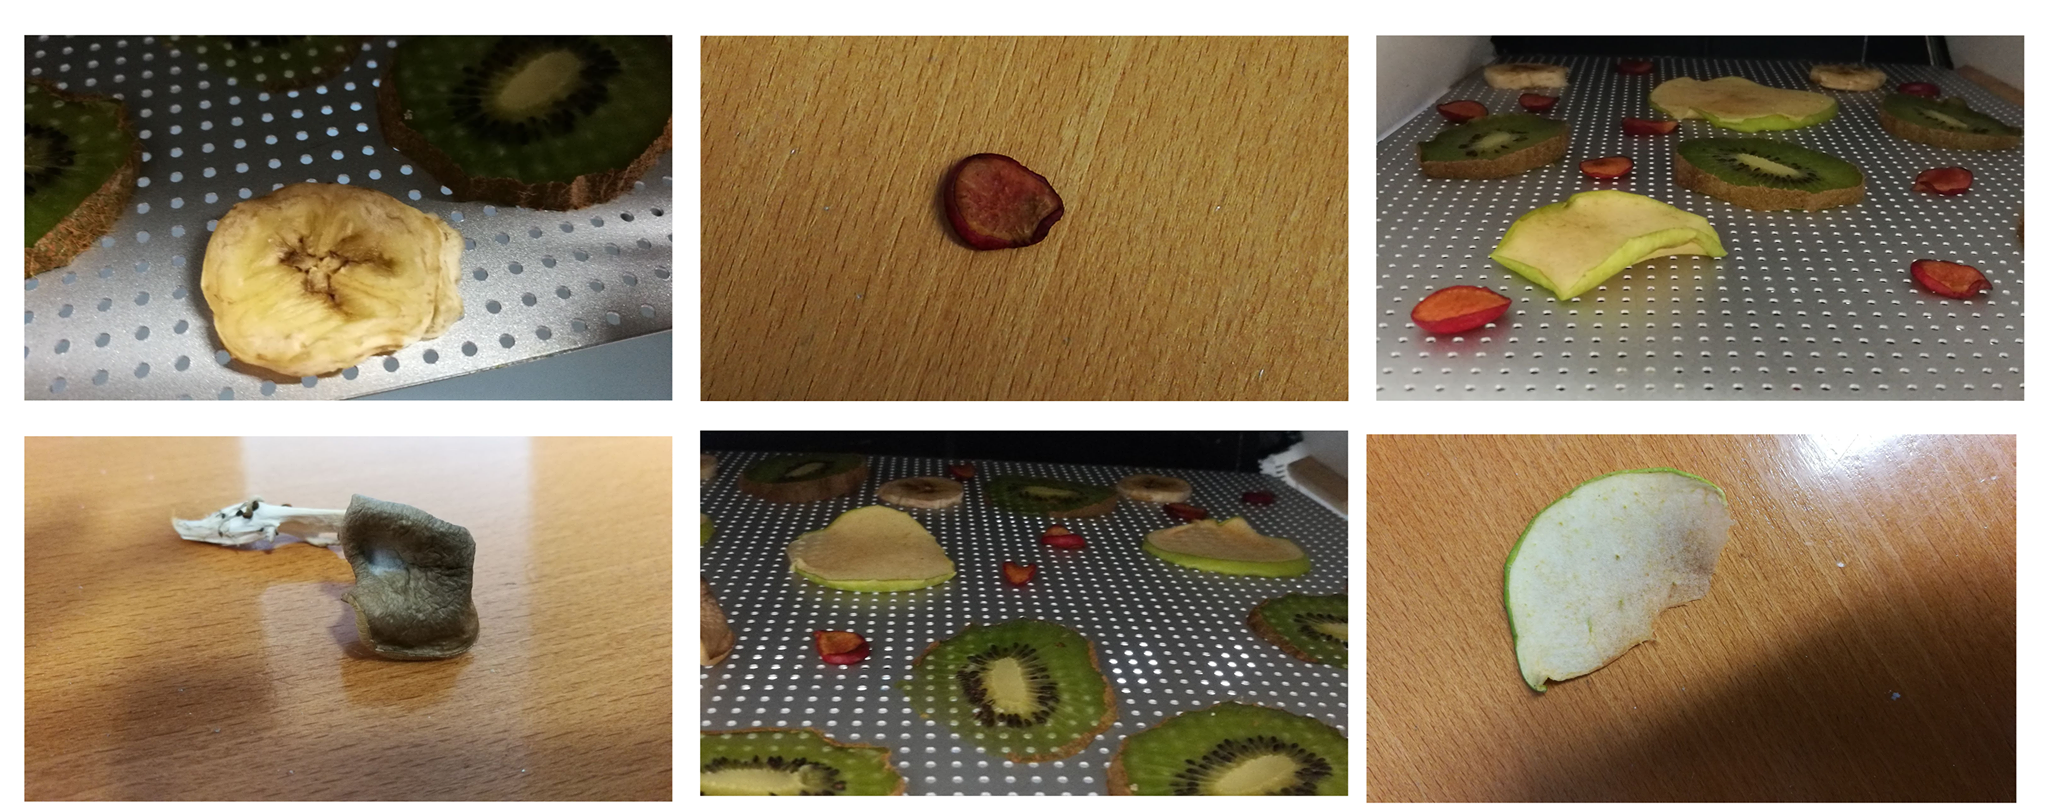
Besides the kiwi, all other types of food tested showed visible signs of dehydration. In the case of the cherries, mushroom, and bananas, these signs were significant. In the case of the apples, the drying process is about half-way done, as expected, according to Table 3. The reason the kiwi hadn't yet shown much change is due to the fact that kiwi is made at 83 % of water.
7.7 Conclusion
The project development started with various ideas that came from the initial brainstorming. Though the ideas were quite different and not really organized at first, a clearer image quickly appeared, and with it, the first SolidWorks models. This idea was furthered developed throughout the whole semester with the different kind of materials and electronics the team thought of. To do so, the team made a lot of research in terms of airflow and evaporation process. Among these researches, there is the sponge experiment that can be seen in the Appendices section.
The main difficulties of the development were the 100 € budget, which restricted the choices in terms of materials, electronics and also, functionalities that could have been included, but also some difficulties in the building of the prototype, with some errors in terms of dimensions, but those errors were quickly solved. The electronics and software part didn't have any problem and, thanks to that, the whole building progressed smoothly.
Overall, the results were satisfying and respected the expectations.
The next chapter will present the conclusions the team drew during this project.
8. Conclusions
8.1 Discussion
The purpose of this semester was to improve teamwork and autonomy skills, as well as multiculturism, around a group project. The project that was chosen, the solar dehydrator, had to be realized while respecting temporal (one semester), budgetary (100 €) and environmental (EU directives to respect and renewable materials to use) requirements.
Consequently, the team created Dryfoo, a solar dehydrator possessing temperature and humidity sensors, a fan, and an LCD interface allowing the user to interact with the product and select his/her program. The user can choose to use an already existing program, but also to enter the temperature and drying time they want by themselves. With the interface, the user can see what current program is on, the temperature and humidity inside the chamber, and also how much time is left for the drying to be done.
With Dryfoo, the team fulfilled all the requirements that it initially imposed and the experience was, for the whole team, very enriching. The help of the supervisors and teachers allowed the project to develop smoothly and without major problem.
8.2 Future Development
The development of this project had several constraints, especially in terms of time and budget, which means that many points could be improved during an eventual future development.
These points are detailed below:
- Making use of the water extracted from the food: catching the evaporated water and using it for other farming purposes.
- Making the dehydrator easier to move: reducing the size or adding wheels could be ideas.
- Internet of Things: allowing the user to be connected and to control the dehydrator at any time and from anywhere.
- Rotating system: having the system rotate according to the radiation of the Sun, to always catch the maximum amount of sunlight.
- Increasing the angle of the solar heat catcher to increase solar energy capture.
- Touchscreen instead of LCD and buttons as the user interface.
- Maritime plywood for the straight parts of the product for being definitely waterproof.
- higher precision components, low power fan,arduino nano (lower power consumption)
Appendices
1. Sponge Experiment
In order to understand better the influence of the airflow in mass transfer, the team was challenged to do an experiment with sponges as represented in Figure 45.
Procedure:
- Place two identical wet sponges in two different situations: One in a box in the Sun and the other in a room without Sun, in front of a fan.
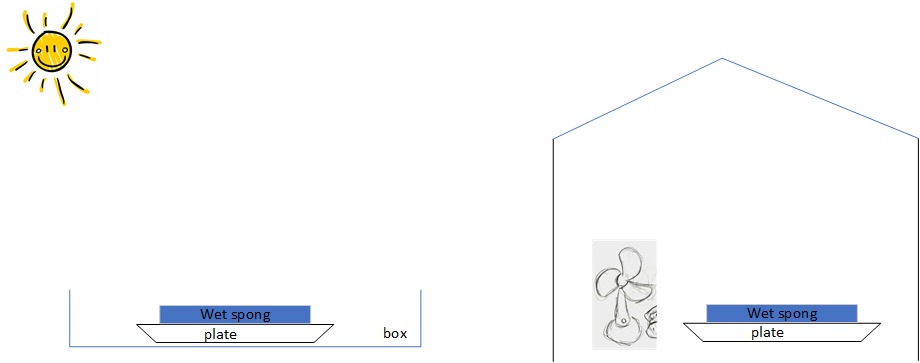
- Turn on the fan when you put the other sponge in the Sun.
- Measure the mass of the two sponges every 15 minutes.
- Draw the graph of the drying as a function of time.
Results:
Tables 44 and 45 shows the results that were measured during this experiment.
| Time (min) | Mass (g) | Loss (g) |
|---|---|---|
| 0 | 198 | 0 |
| 15 | 195 | 3 |
| 30 | 195 | 3 |
| 45 | 193 | 5 |
| 60 | 193 | 5 |
| 75 | 192 | 6 |
| 90 | 192 | 6 |
| 105 | 190 | 8 |
| 120 | 189 | 9 |
| 135 | 189 | 9 |
| 150 | 186 | 12 |
| 165 | 186 | 12 |
| 180 | 185 | 13 |
| Time (min) | Mass (g) | Loss (g) |
|---|---|---|
| 0 | 183 | 0 |
| 15 | 179 | 4 |
| 30 | 177 | 6 |
| 45 | 176 | 7 |
| 60 | 175 | 8 |
| 75 | 173 | 10 |
| 90 | 172 | 11 |
| 105 | 172 | 11 |
| 120 | 171 | 12 |
| 135 | 170 | 13 |
| 150 | 170 | 13 |
| 165 | 169 | 14 |
| 180 | 168 | 15 |
Final graphic:
With these results, the graphic in Figure 46 was established.
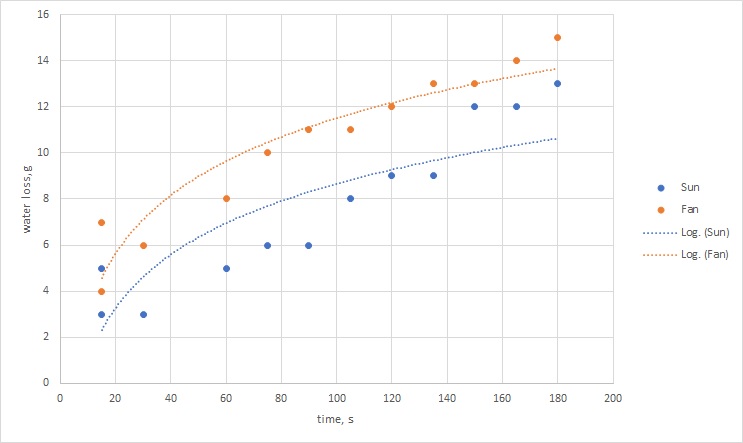
Conclusion
In short, based on the results obtained, it is possible to conclude that the use of the fan was more efficient than the use of the Sun due to the occurrence of mass transfer that allowed the water to vanish instead of keeping in continuous contact with the sponge as in the Sun scenario. This experiment showed the importance of airflow in the drying process.